Charts & Reports: Adding “or” filters to reports
 Scott O'Reilly
July 13, 2021
Scott O'Reilly
July 13, 2021
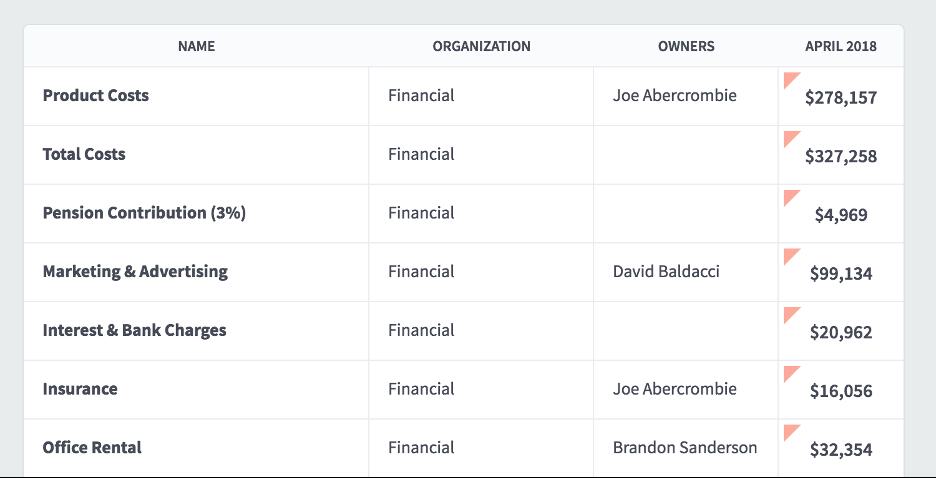
Spider Impact has the ability to add “or” filters to reports. Let’s start with a simple example that shows all of the measures that are red for a month.
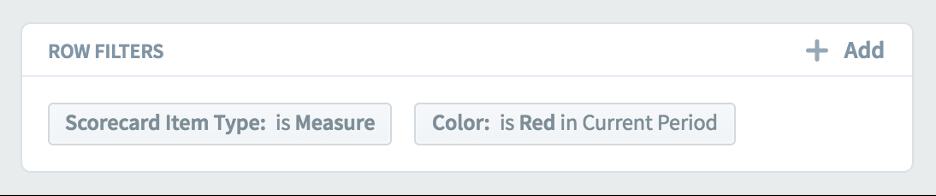
Here’s what the two filters look like. The item type is measure and the color is red.
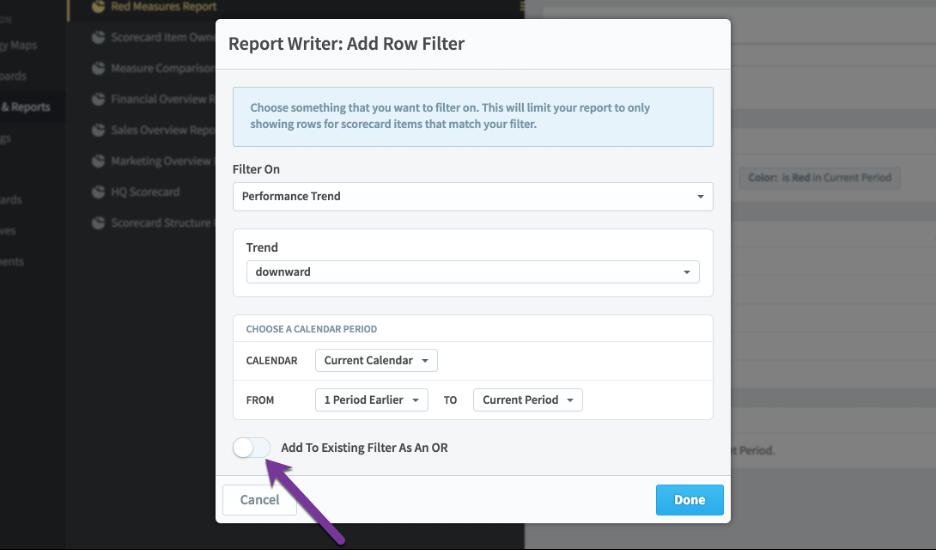
Let’s say we want to change this report to show not only red measures, but also measures that are trending downward. That way we’ll have a single report showing all of the measures we need to keep an eye on.
In order to do this, we’ll add a new “downward trend” filter, and before we click “done,” we’ll turn on this “or filter” switch on the bottom.
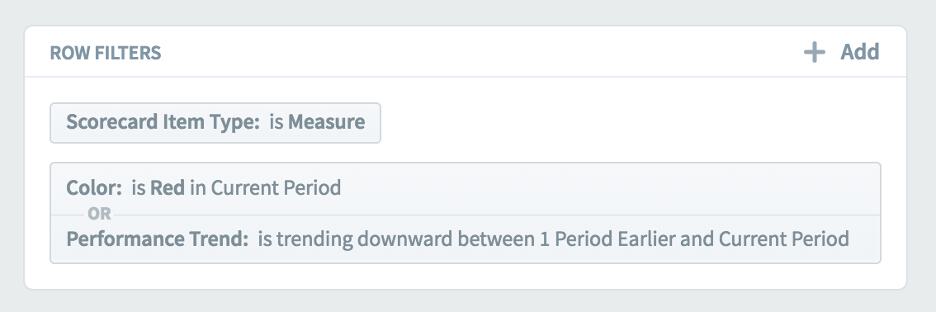
Now we need to choose which existing filter we’re going to add our new filter to. Since we want to show all “red” or all “downward trending,” we’ll choose the red color filter to use with our “or.”
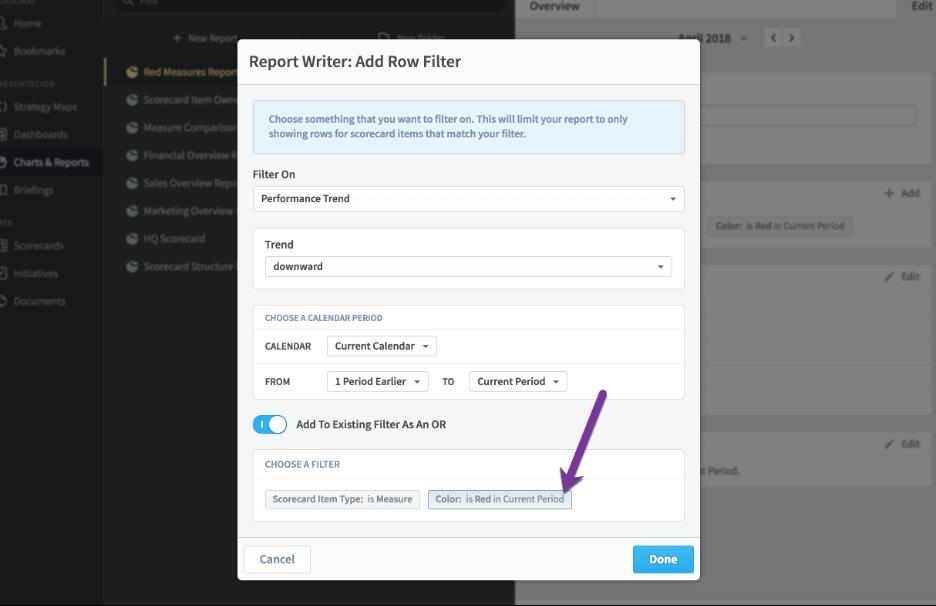
This is what the filters look like now. This means that the report will show all items that are measures and (red or downward trending).
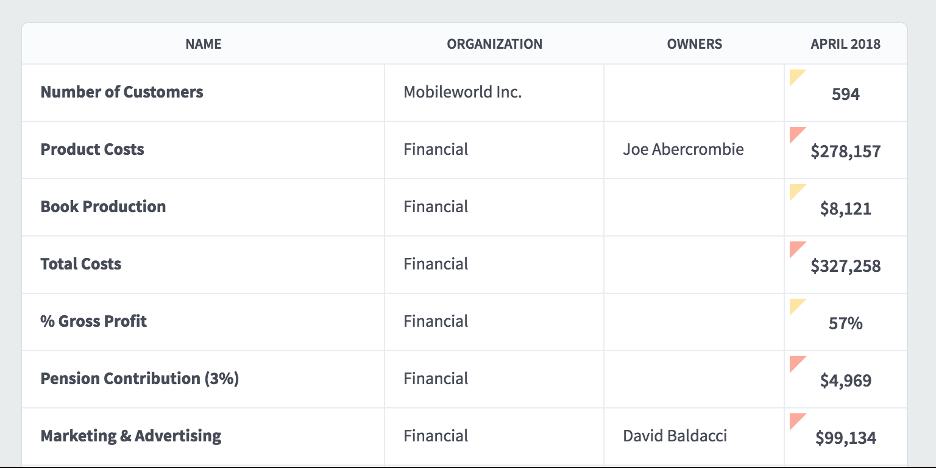
And here’s our new report.
Interested in Experiencing Spider Impact for Yourself?
Request a Self-Guided Test Drive or a Live Demo.


Experience Spider Impact for Free
Schedule a live demo or claim your free 30-day trial. We’re standing by to either show off Spider Impact or turn your data into a prototype for free.