Annual Measure Data Report in 3.1
Reports
 Scott O'Reilly
February 5, 2018
Scott O'Reilly
February 5, 2018
Scott O'Reilly
February 5, 2018
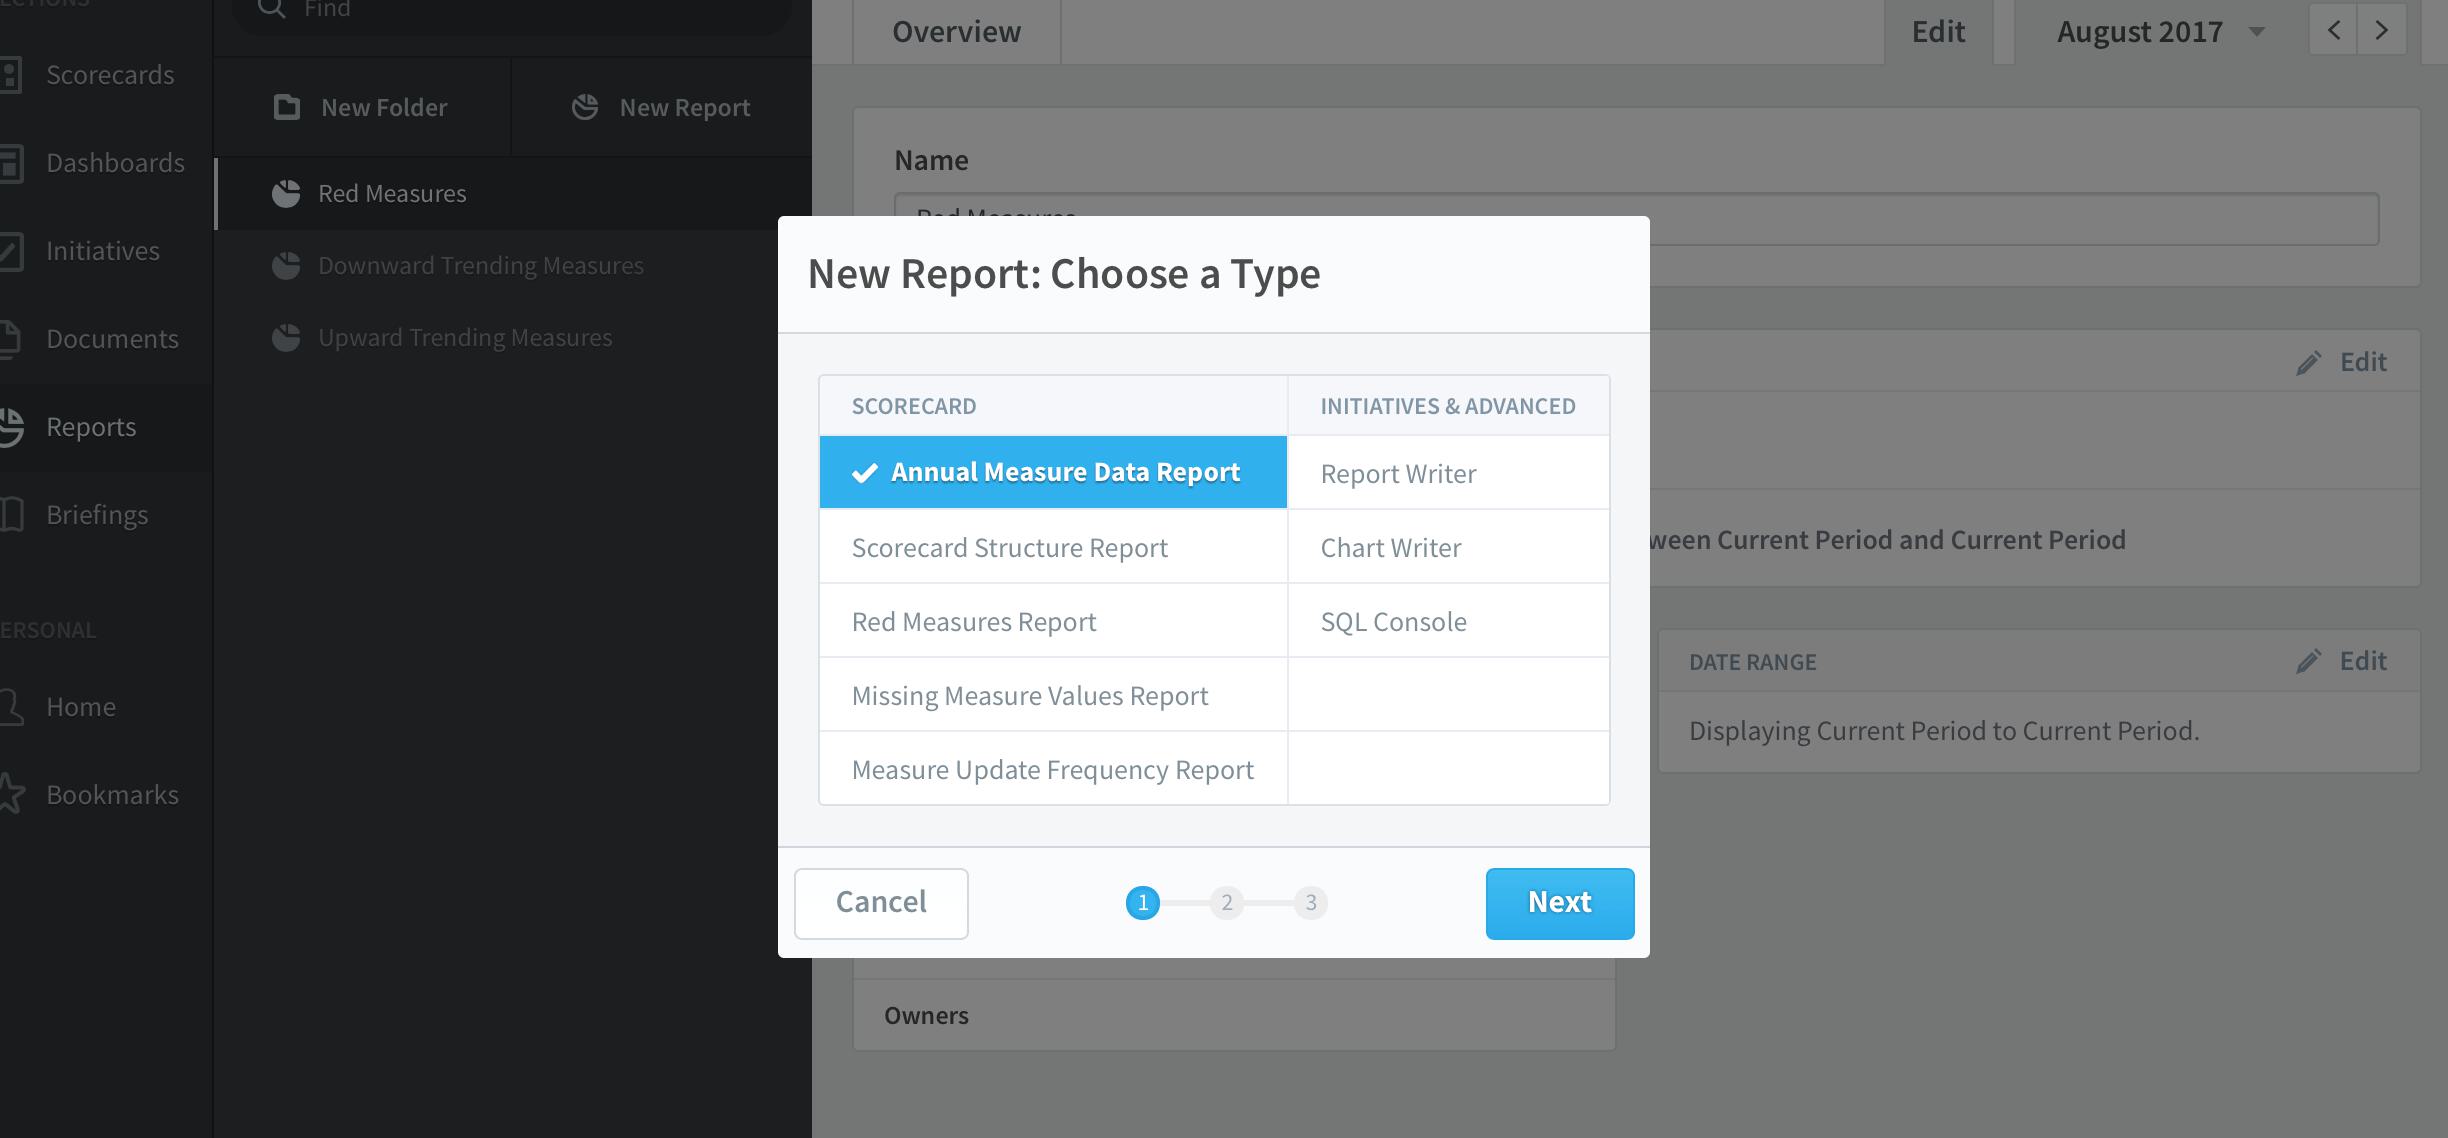
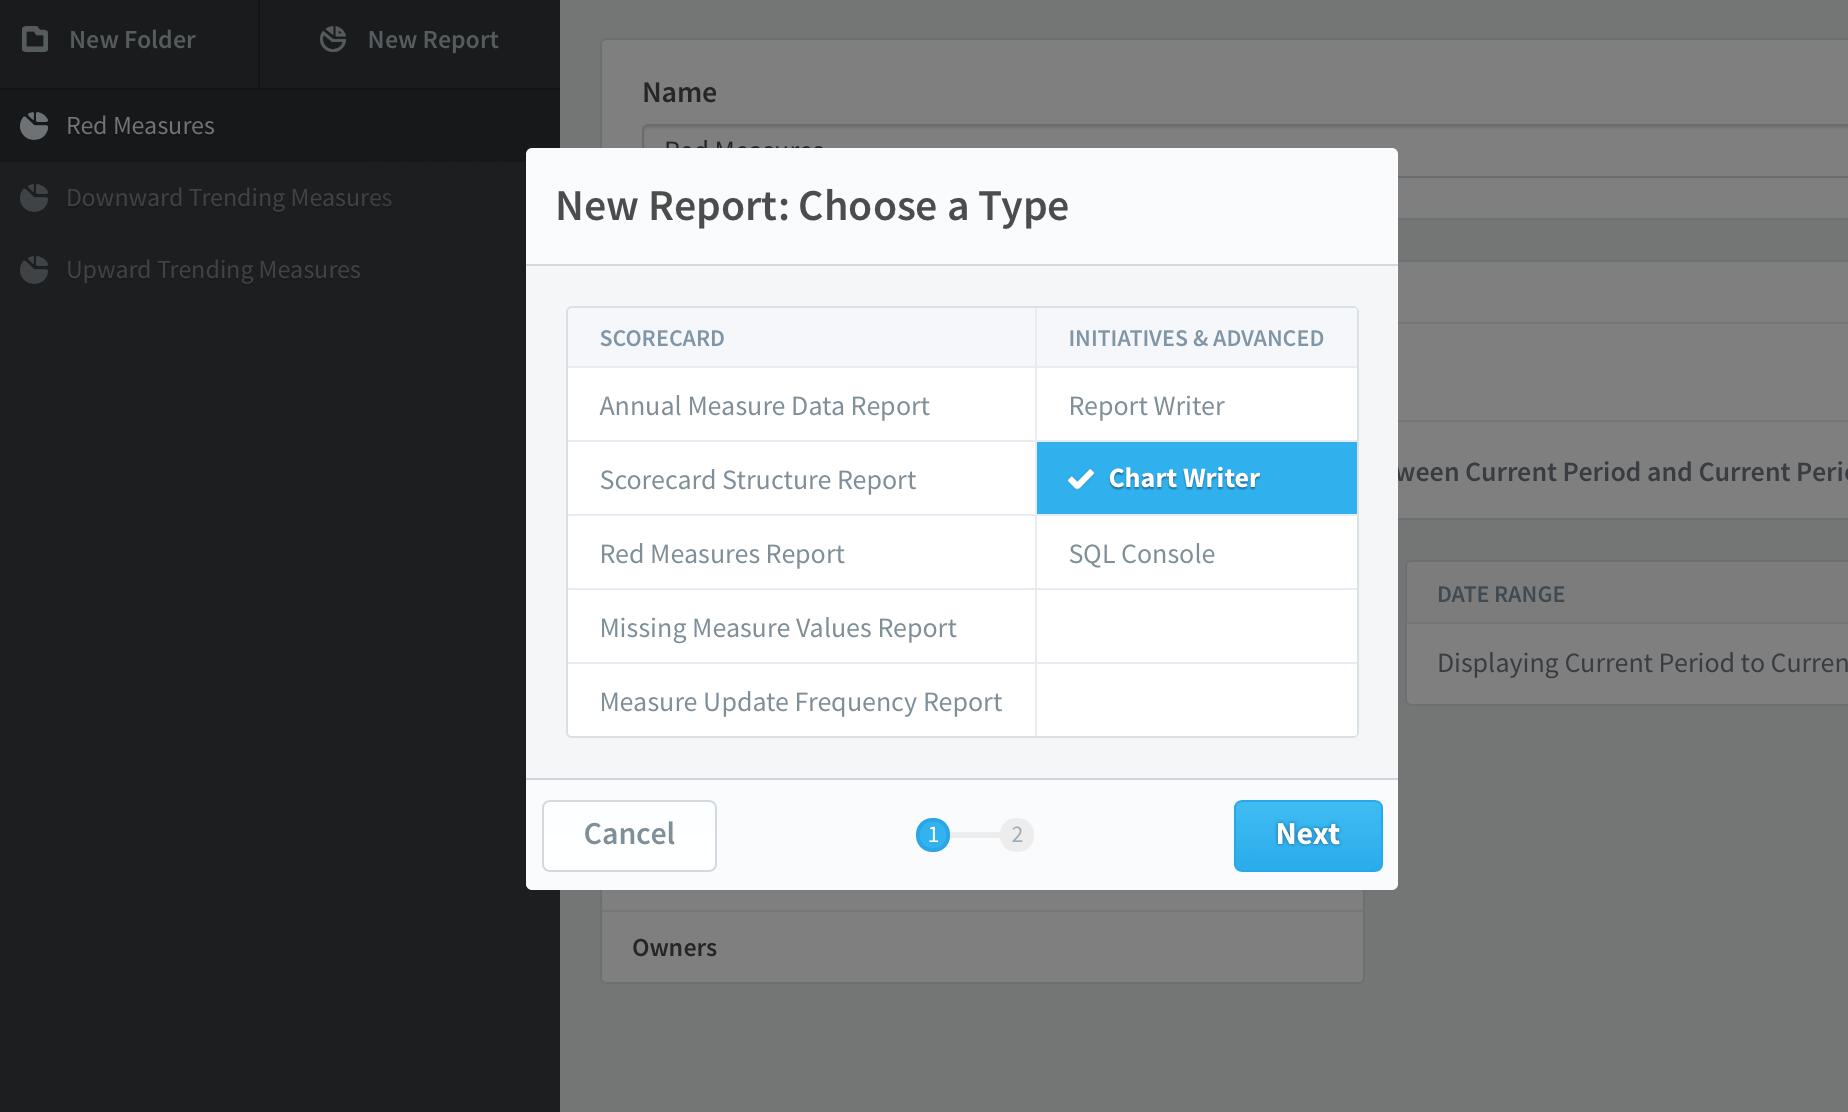
The second new report in version 3.1 is the annual measure data report. This is similar to the data shown on the Scorecards Measures tab.
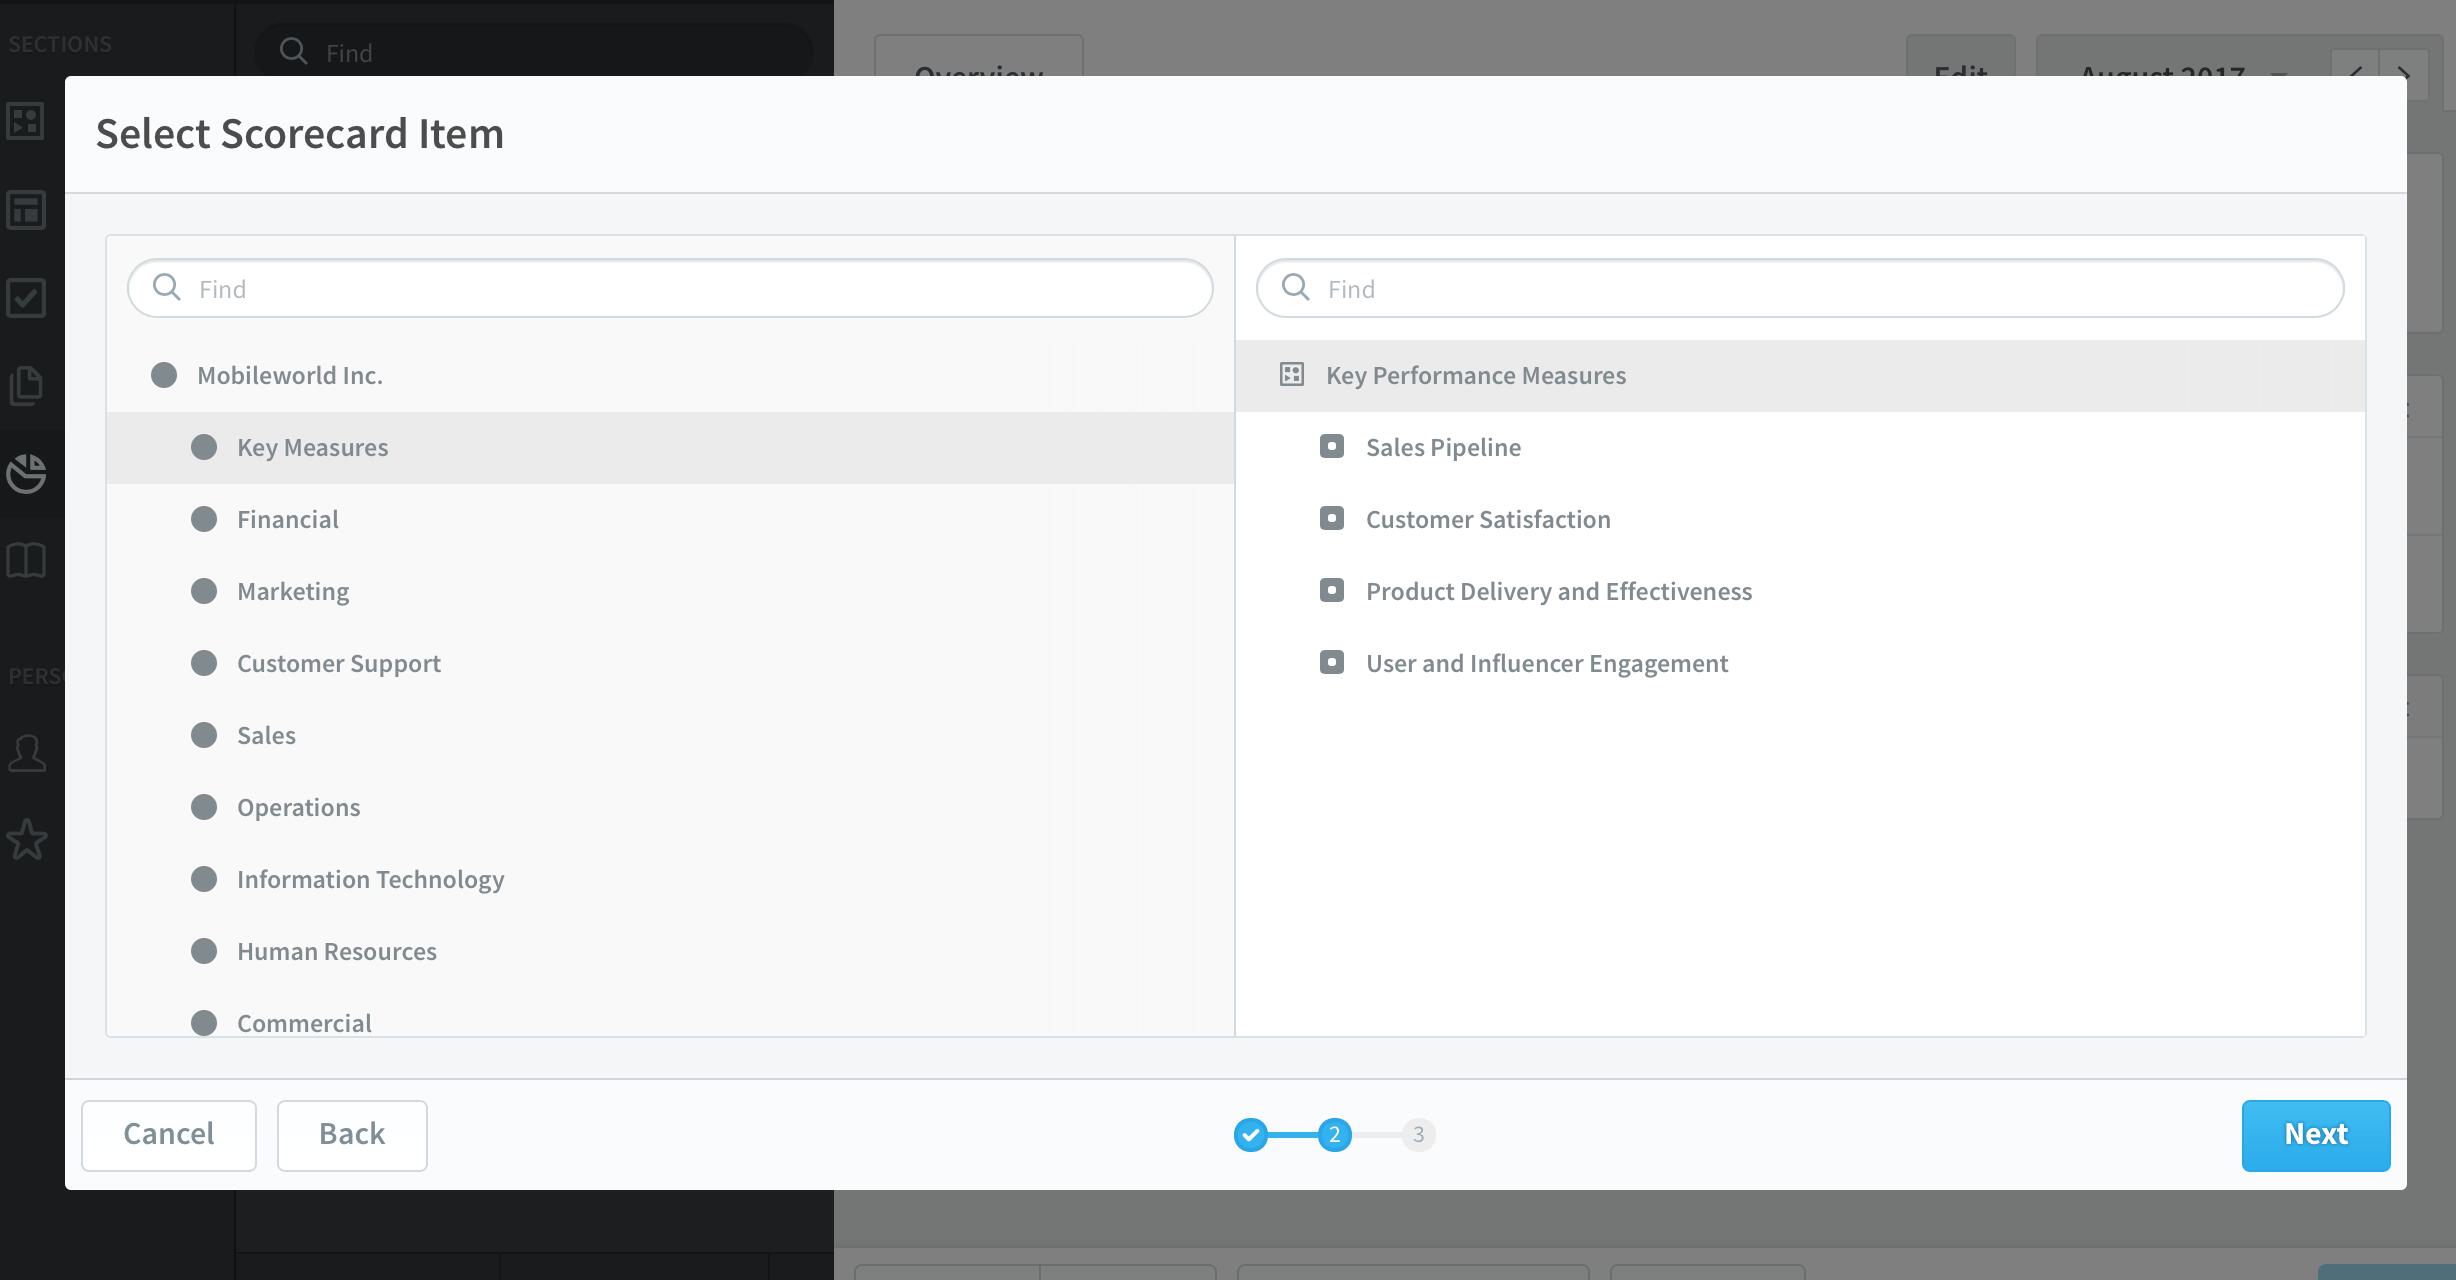
The first step in building the report is choosing which scorecard item for which you want to display measures.
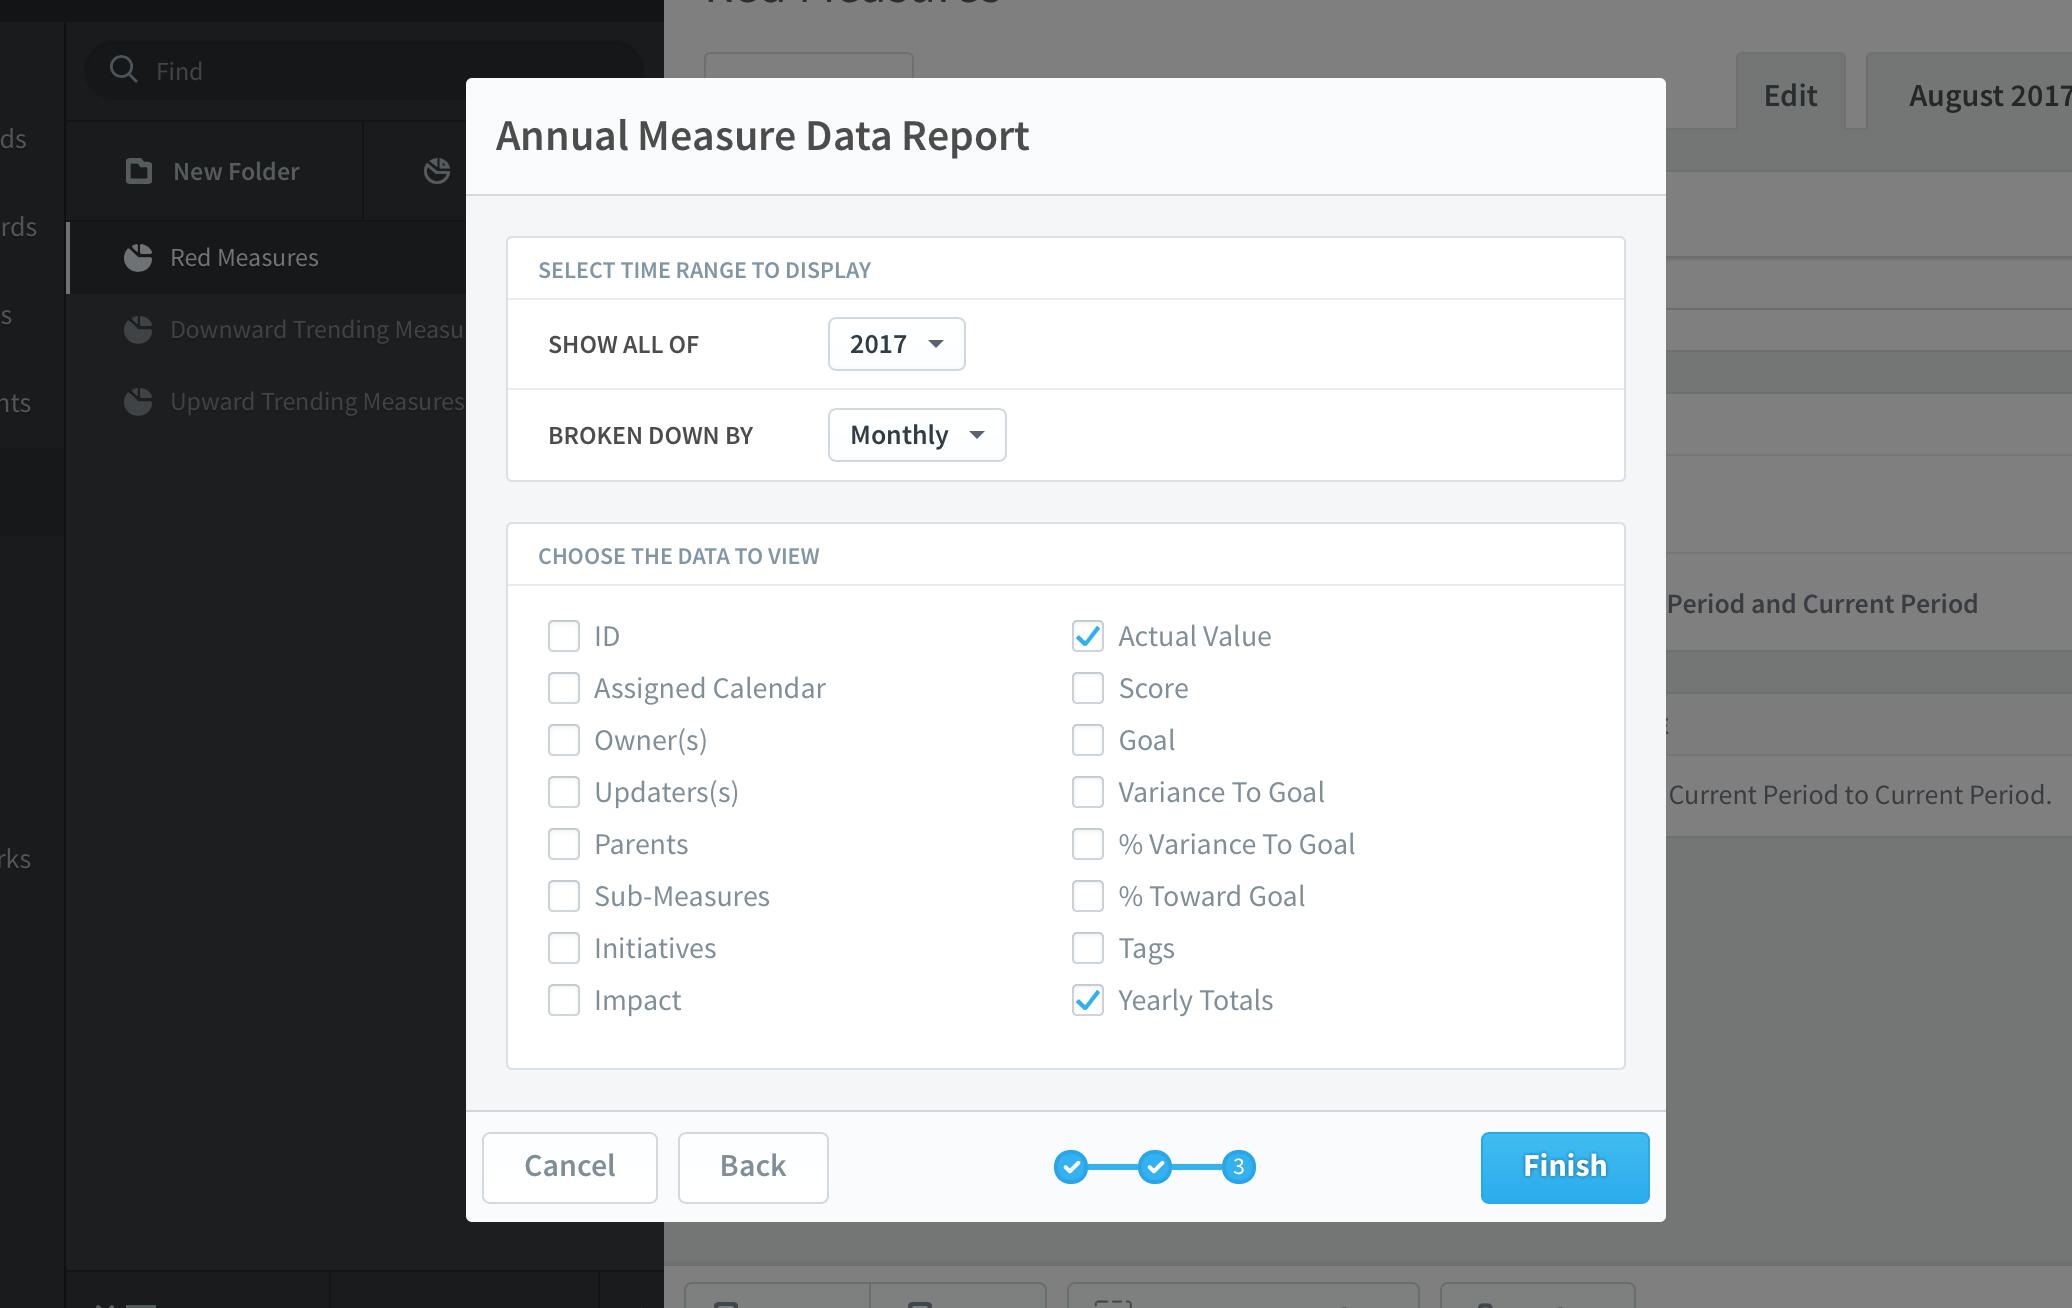
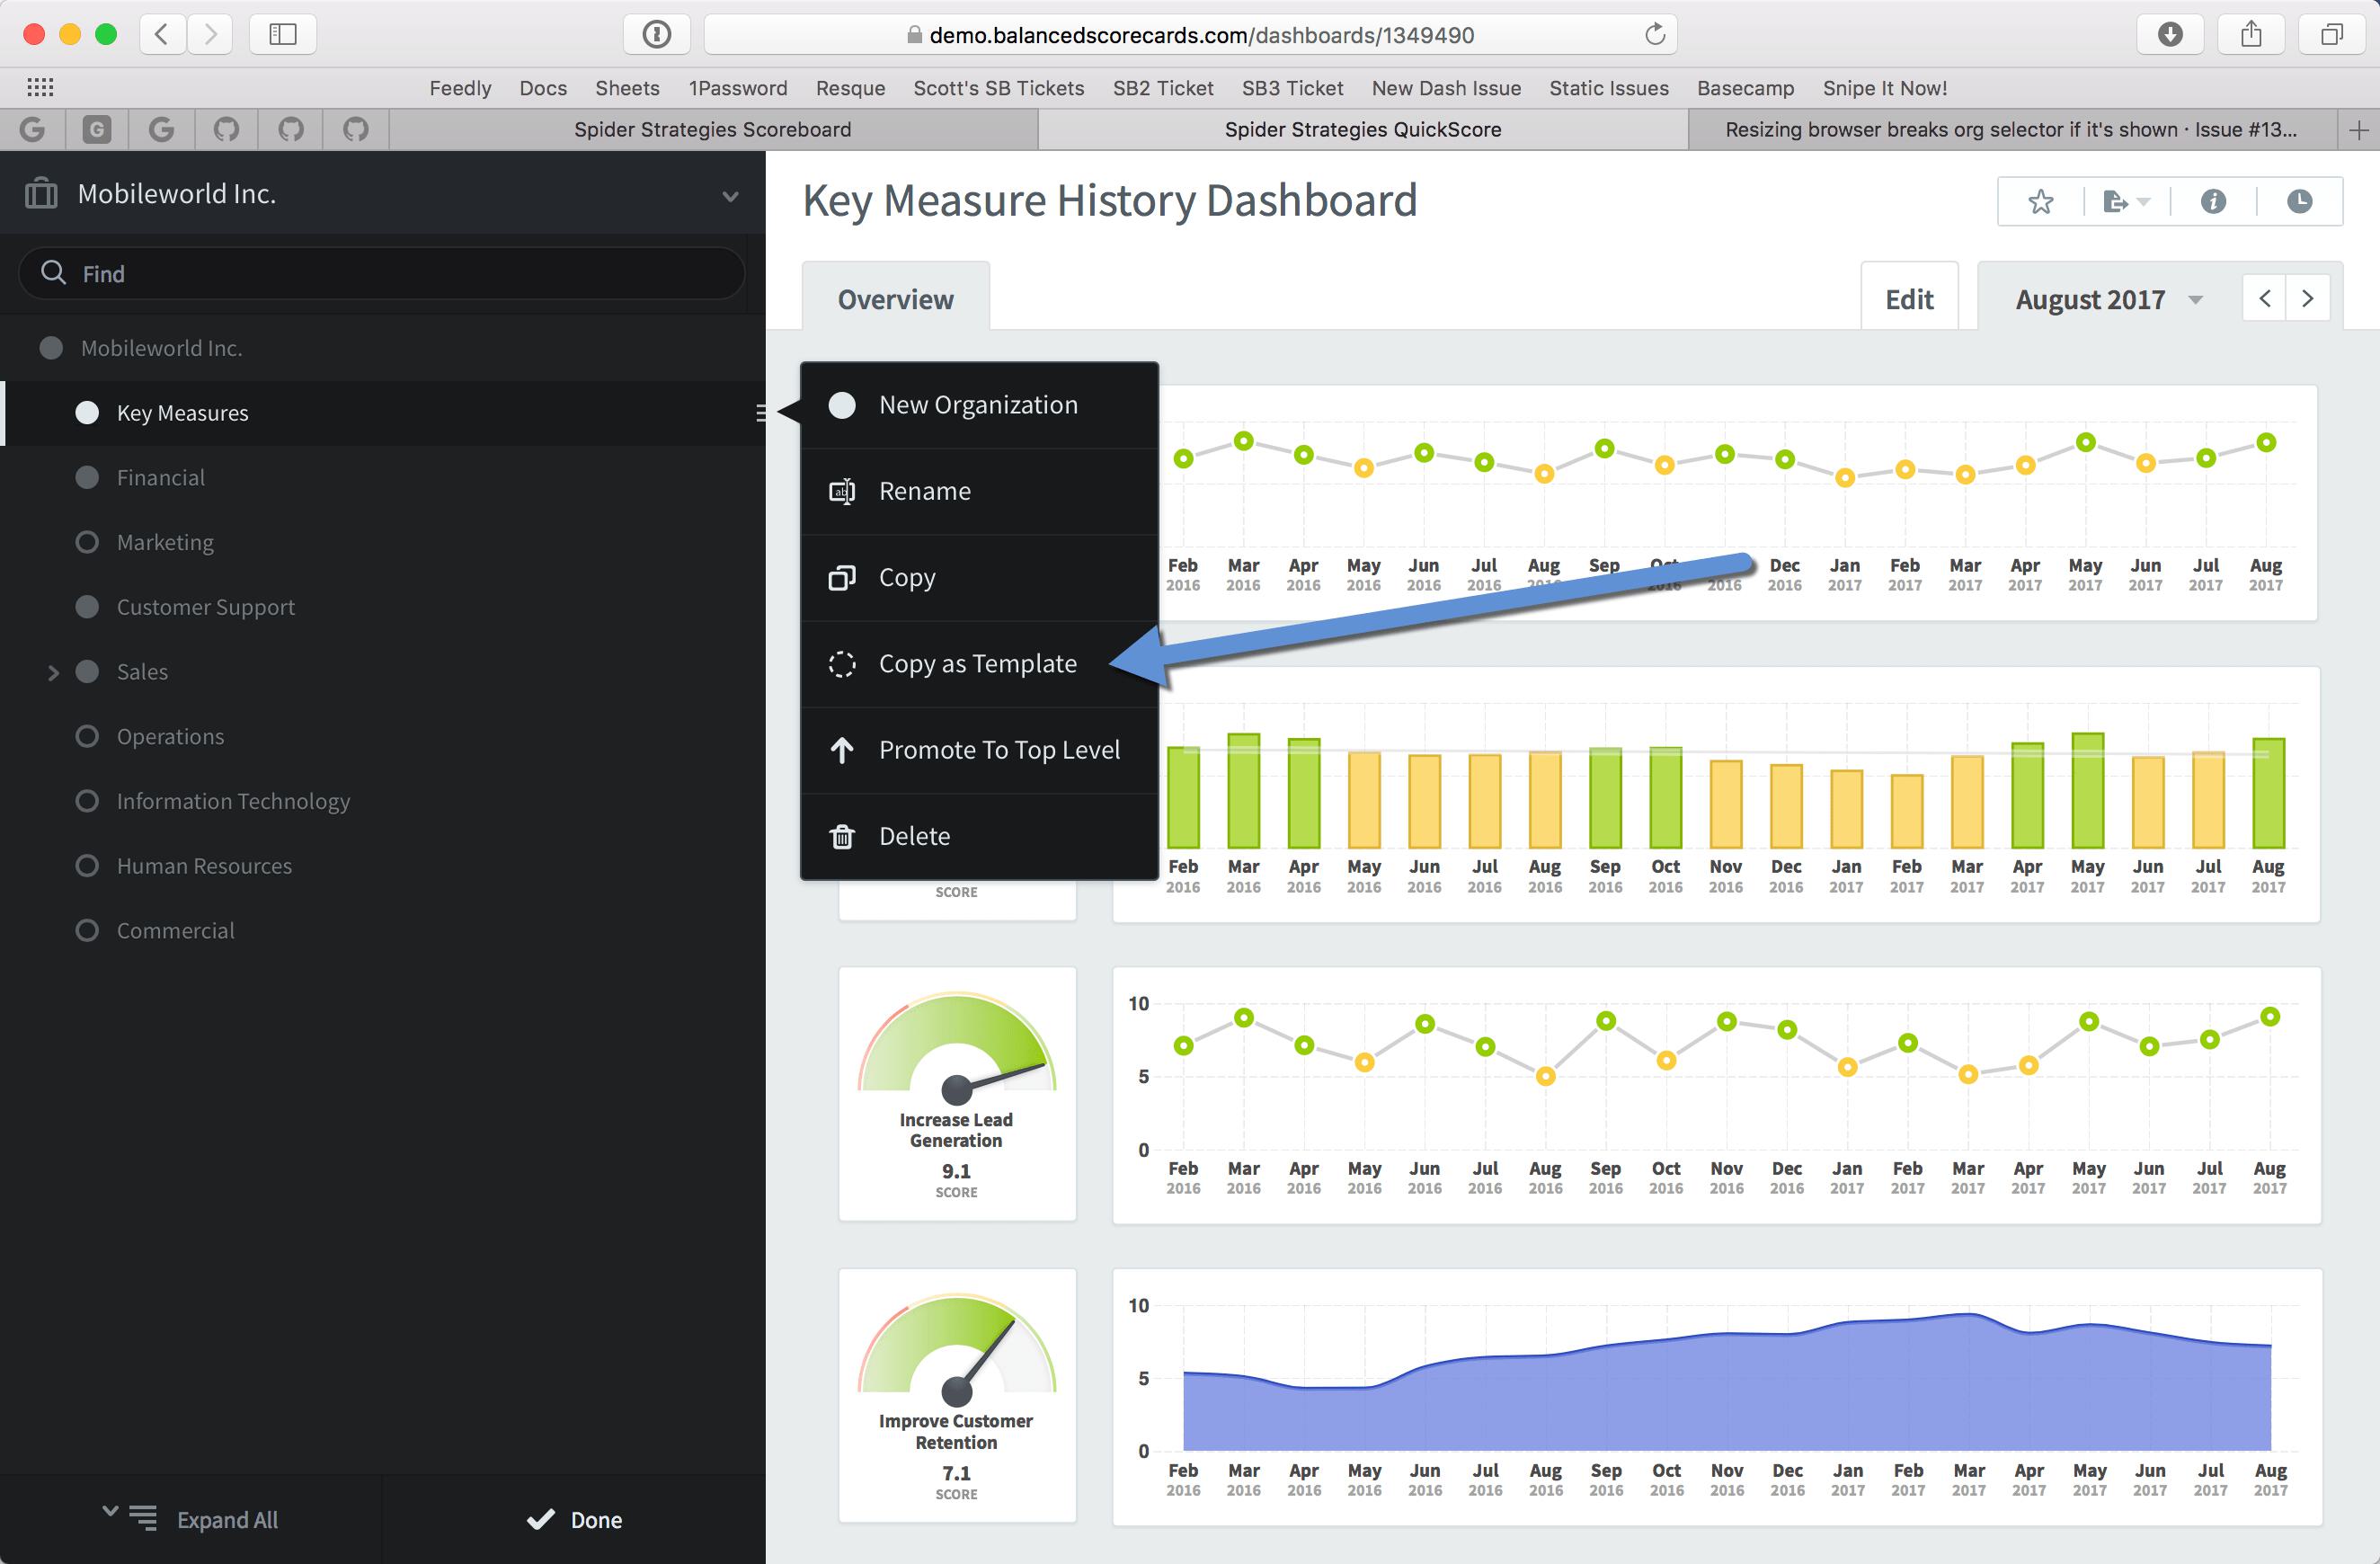
The next step is choosing what data should be shown on the report. The defaults only show the actual values and yearly totals.
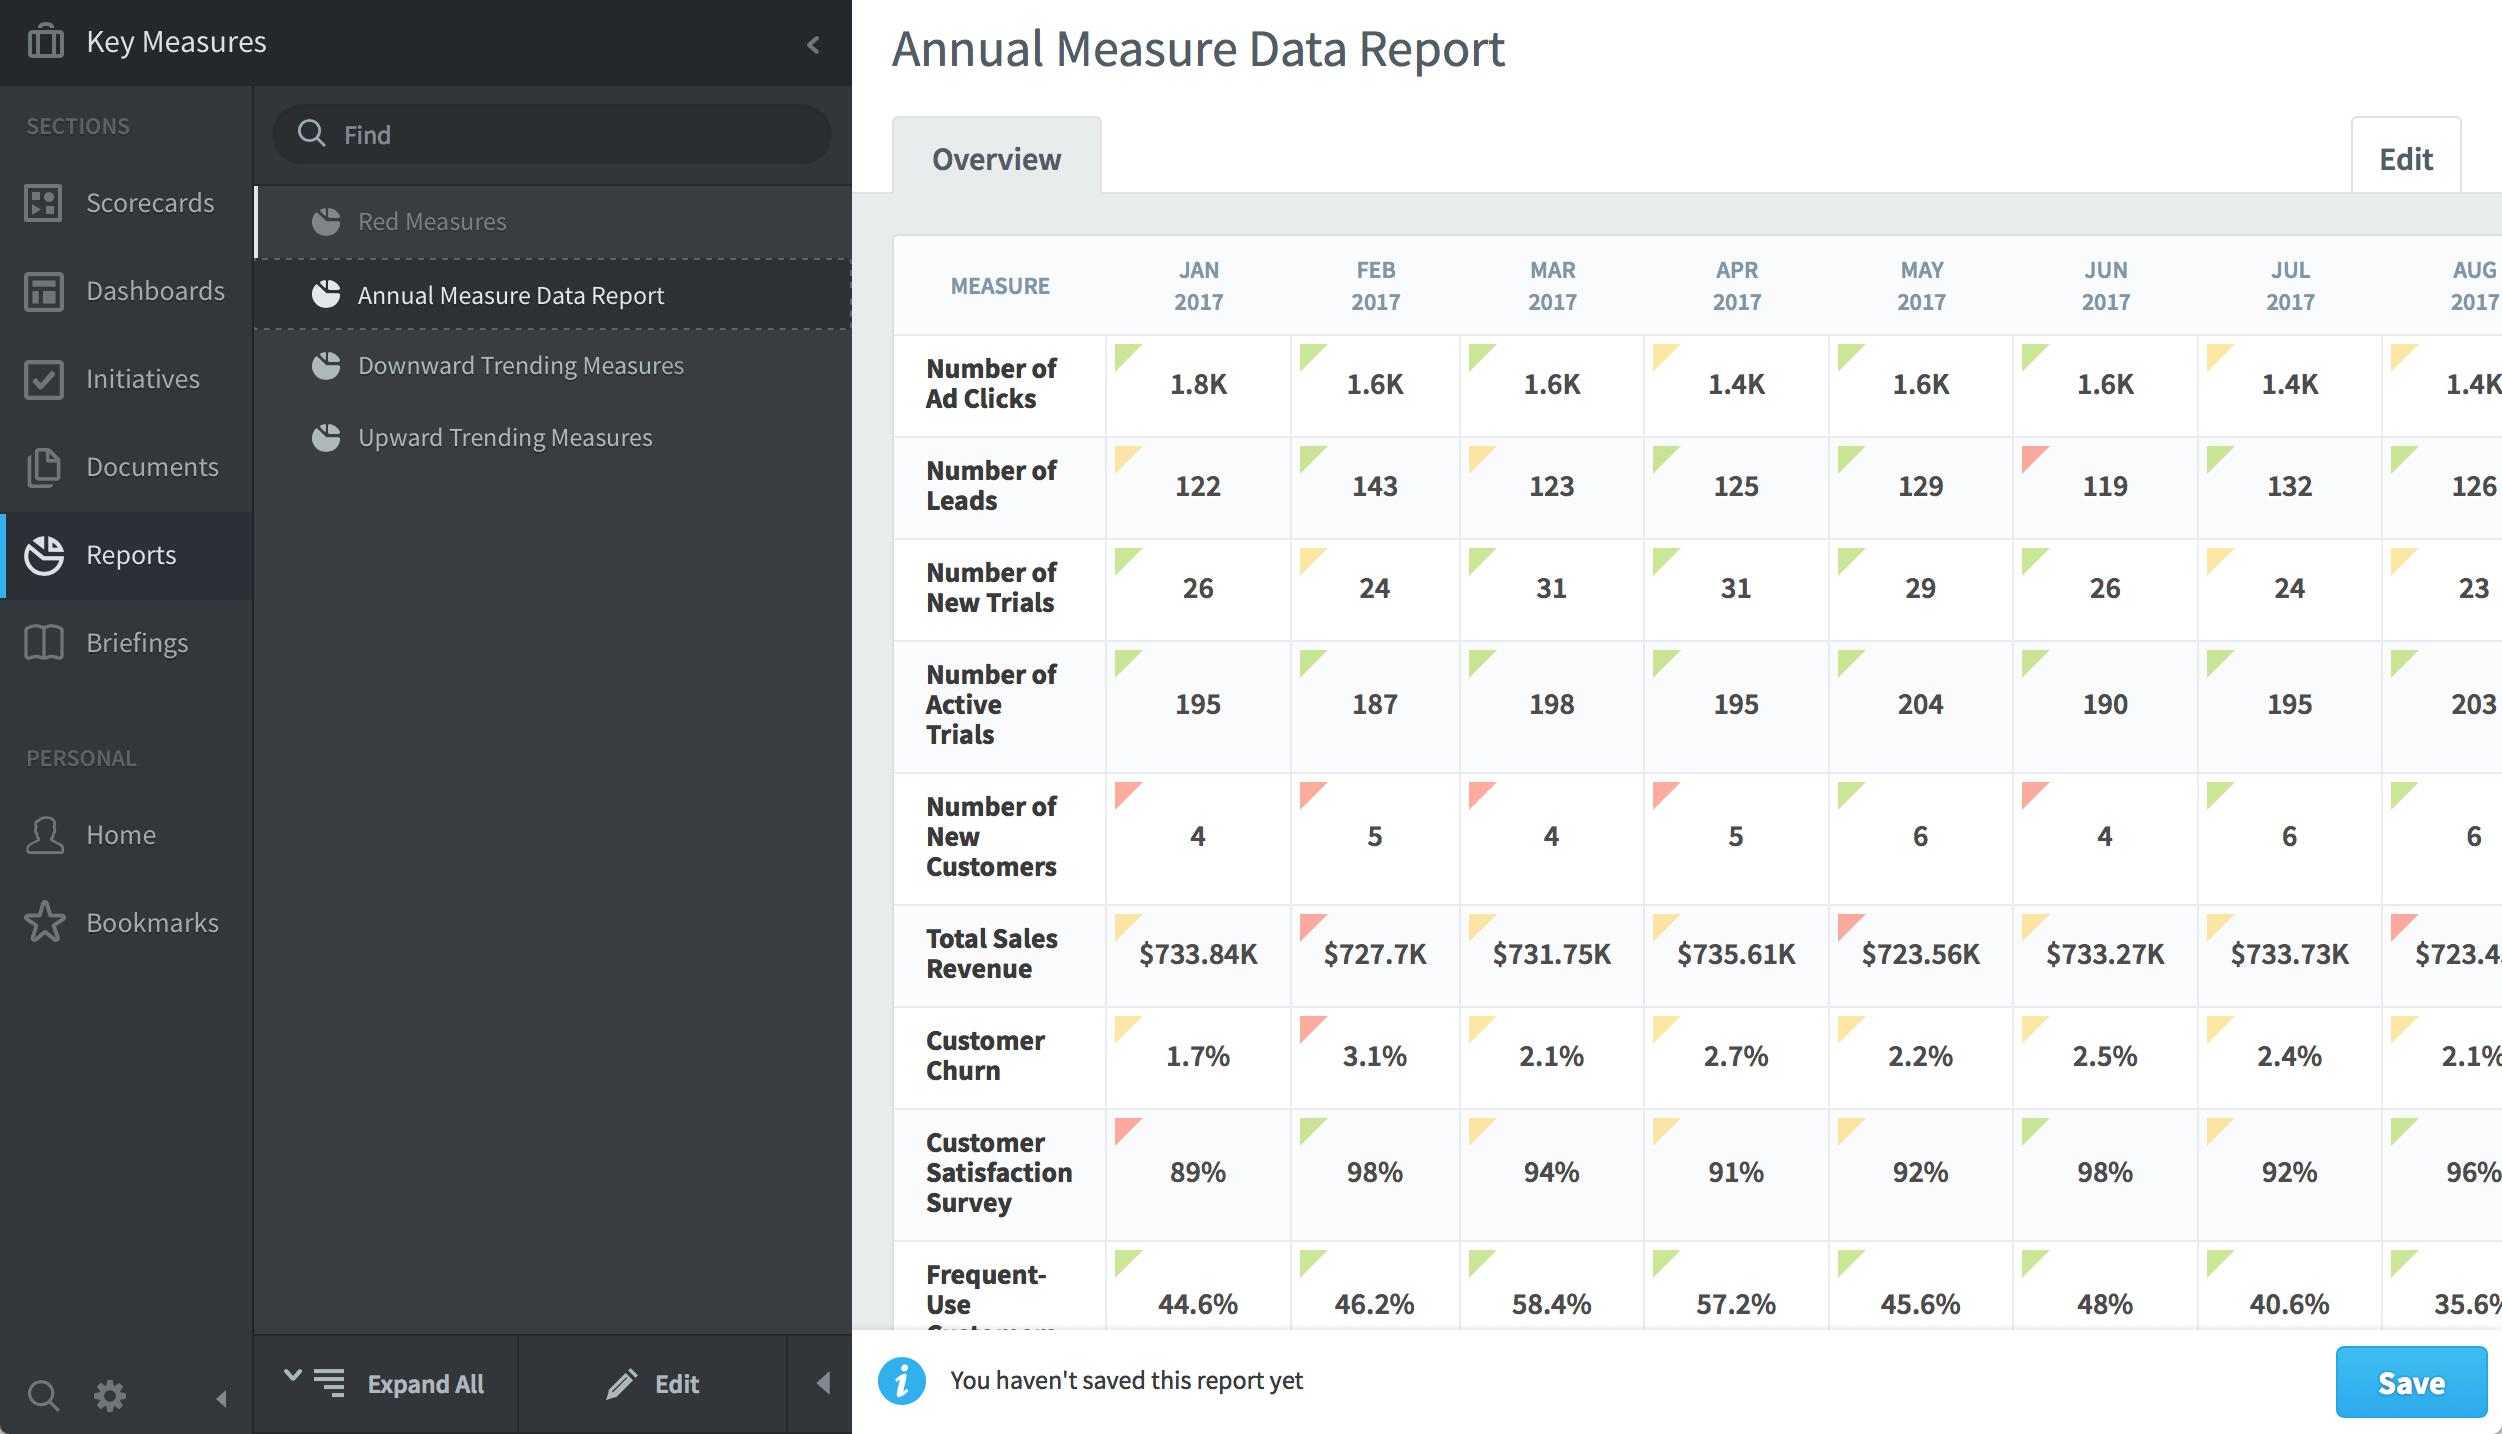
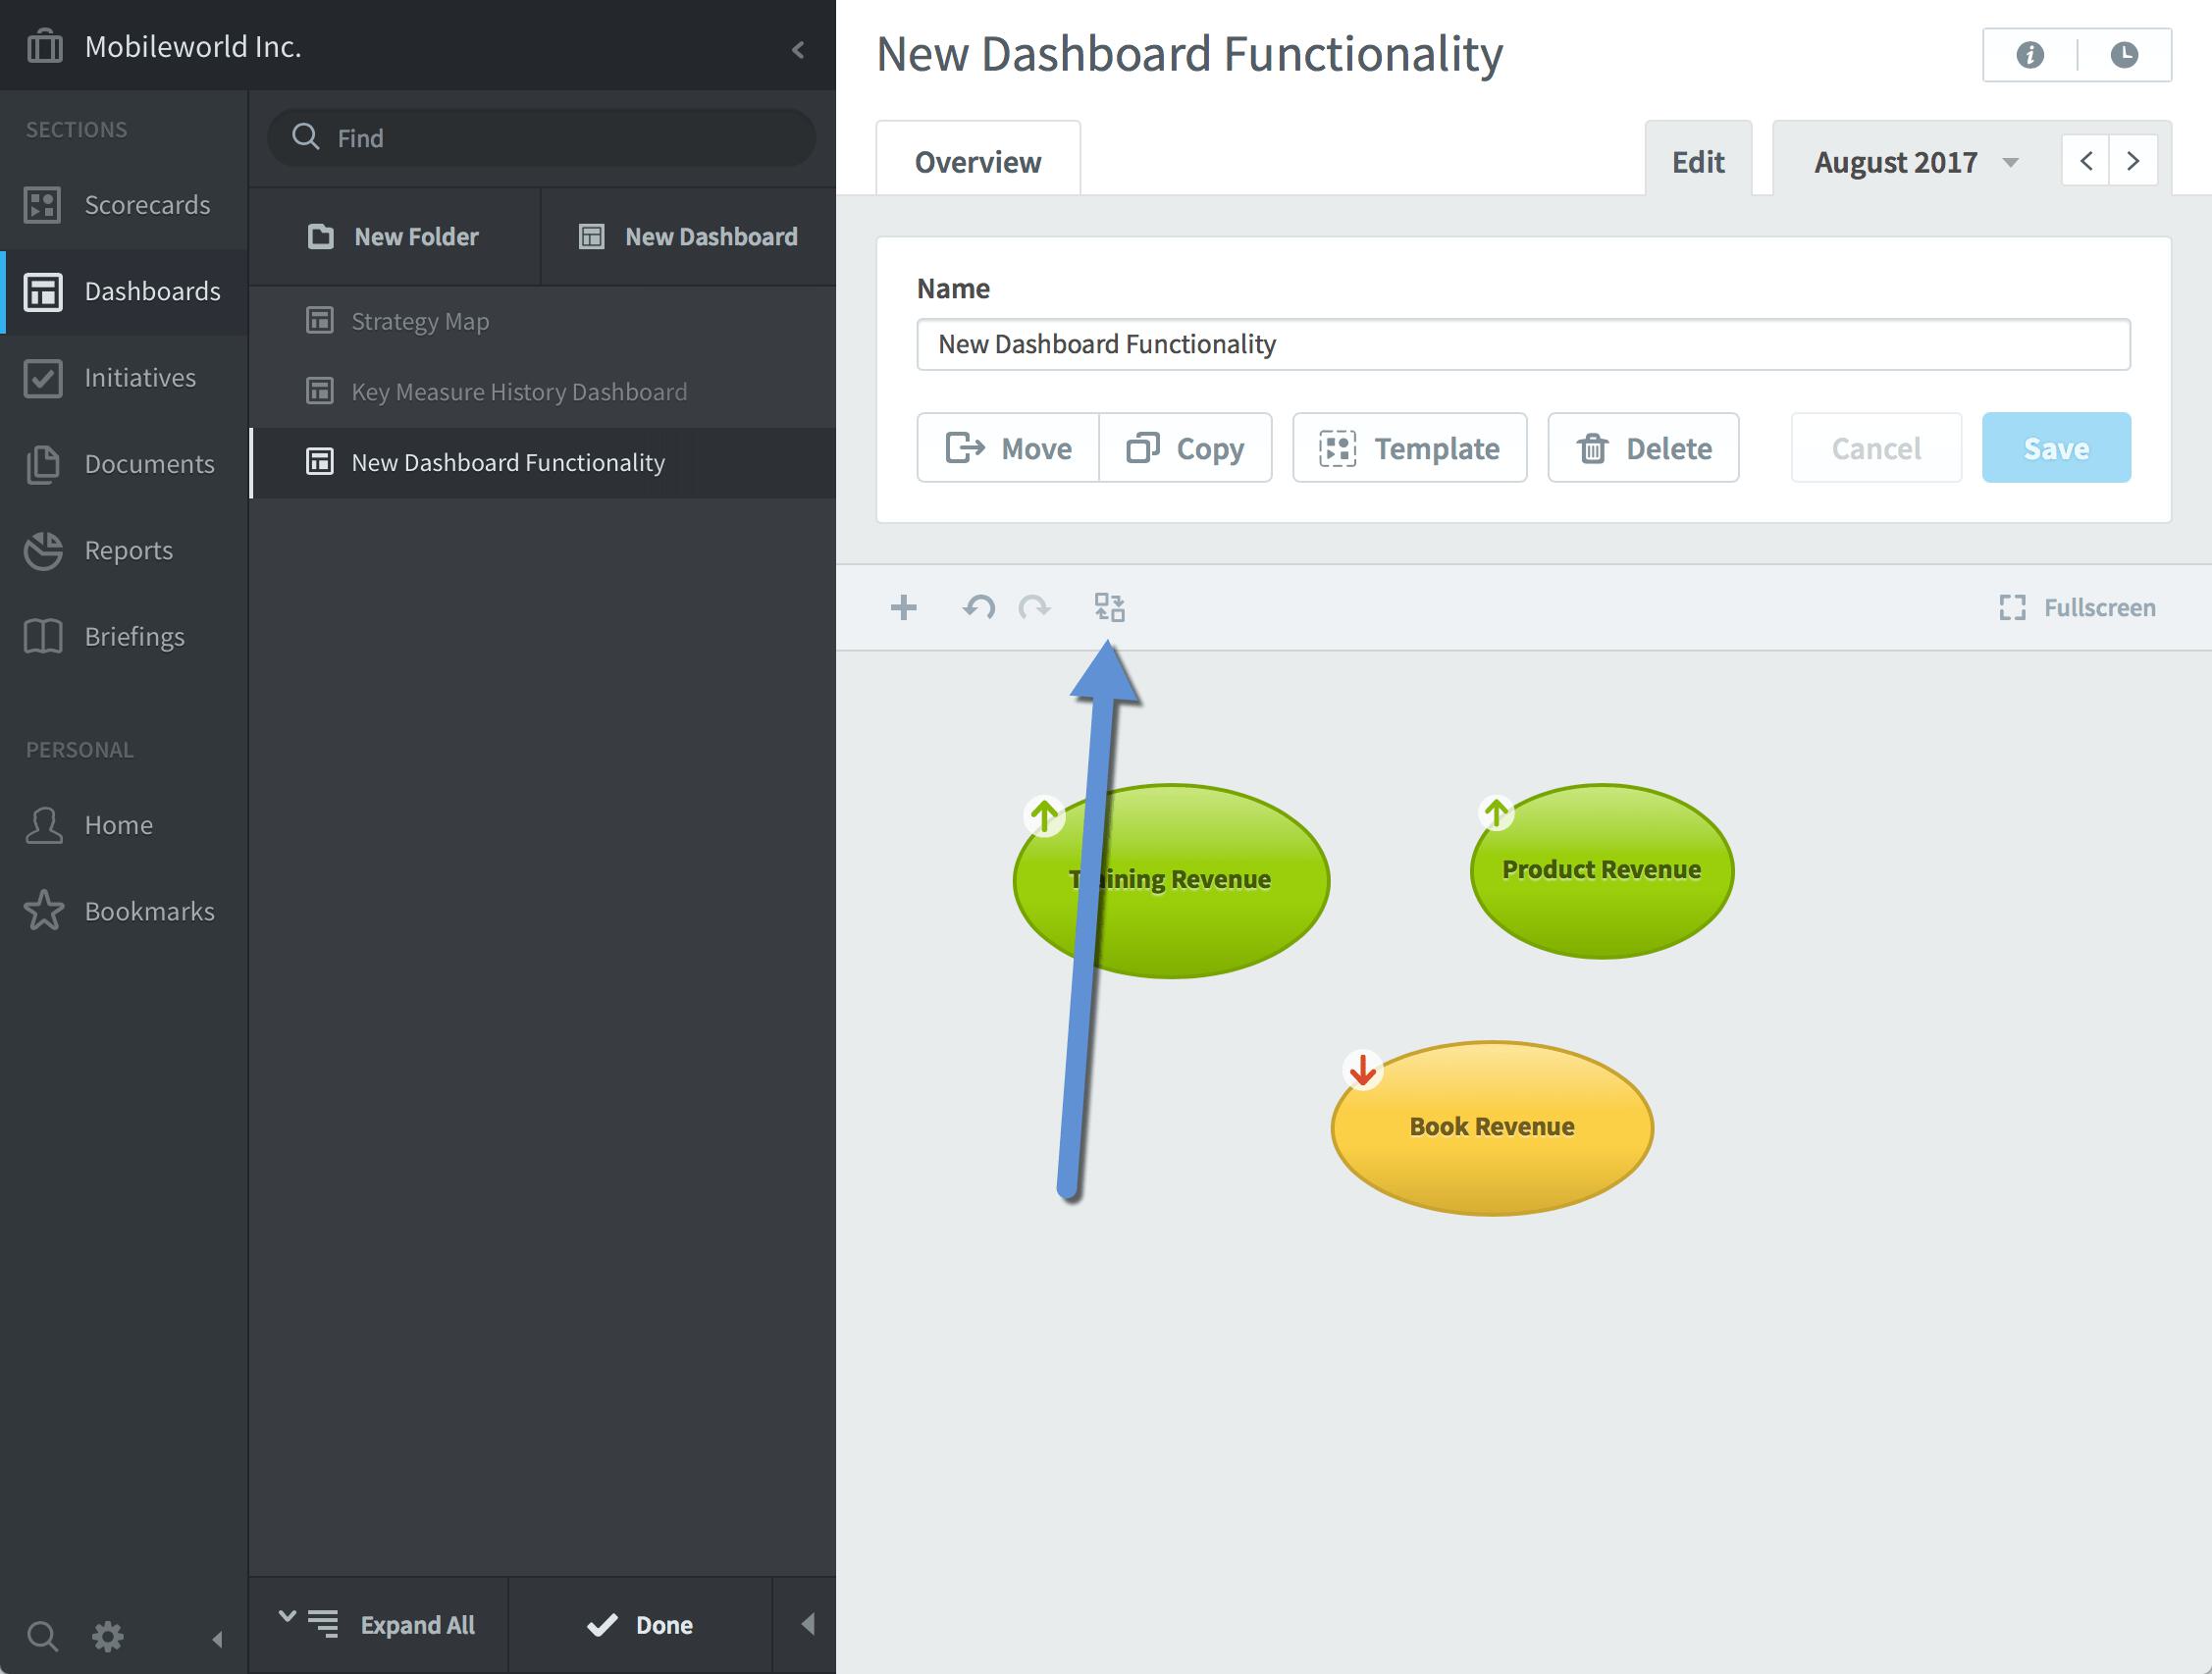
This is what the chart looks like when it's completed.


Experience Spider Impact for Free
Schedule a live demo or claim your free 30-day trial. We’re standing by to either show off Spider Impact or turn your data into a prototype for free.