Automatically Generated Dashboards in Scoreboard 3.2
Dashboards
 Scott O'Reilly
October 11, 2018
Scott O'Reilly
October 11, 2018
Scott O'Reilly
October 11, 2018
When you create a new dashboard in Scoreboard, you now have the option to automatically add widgets for each KPI in the organization. It’s a great starting point for building KPI dashboards.
This is what the “new dashboard” screen looks like now in Scoreboard.
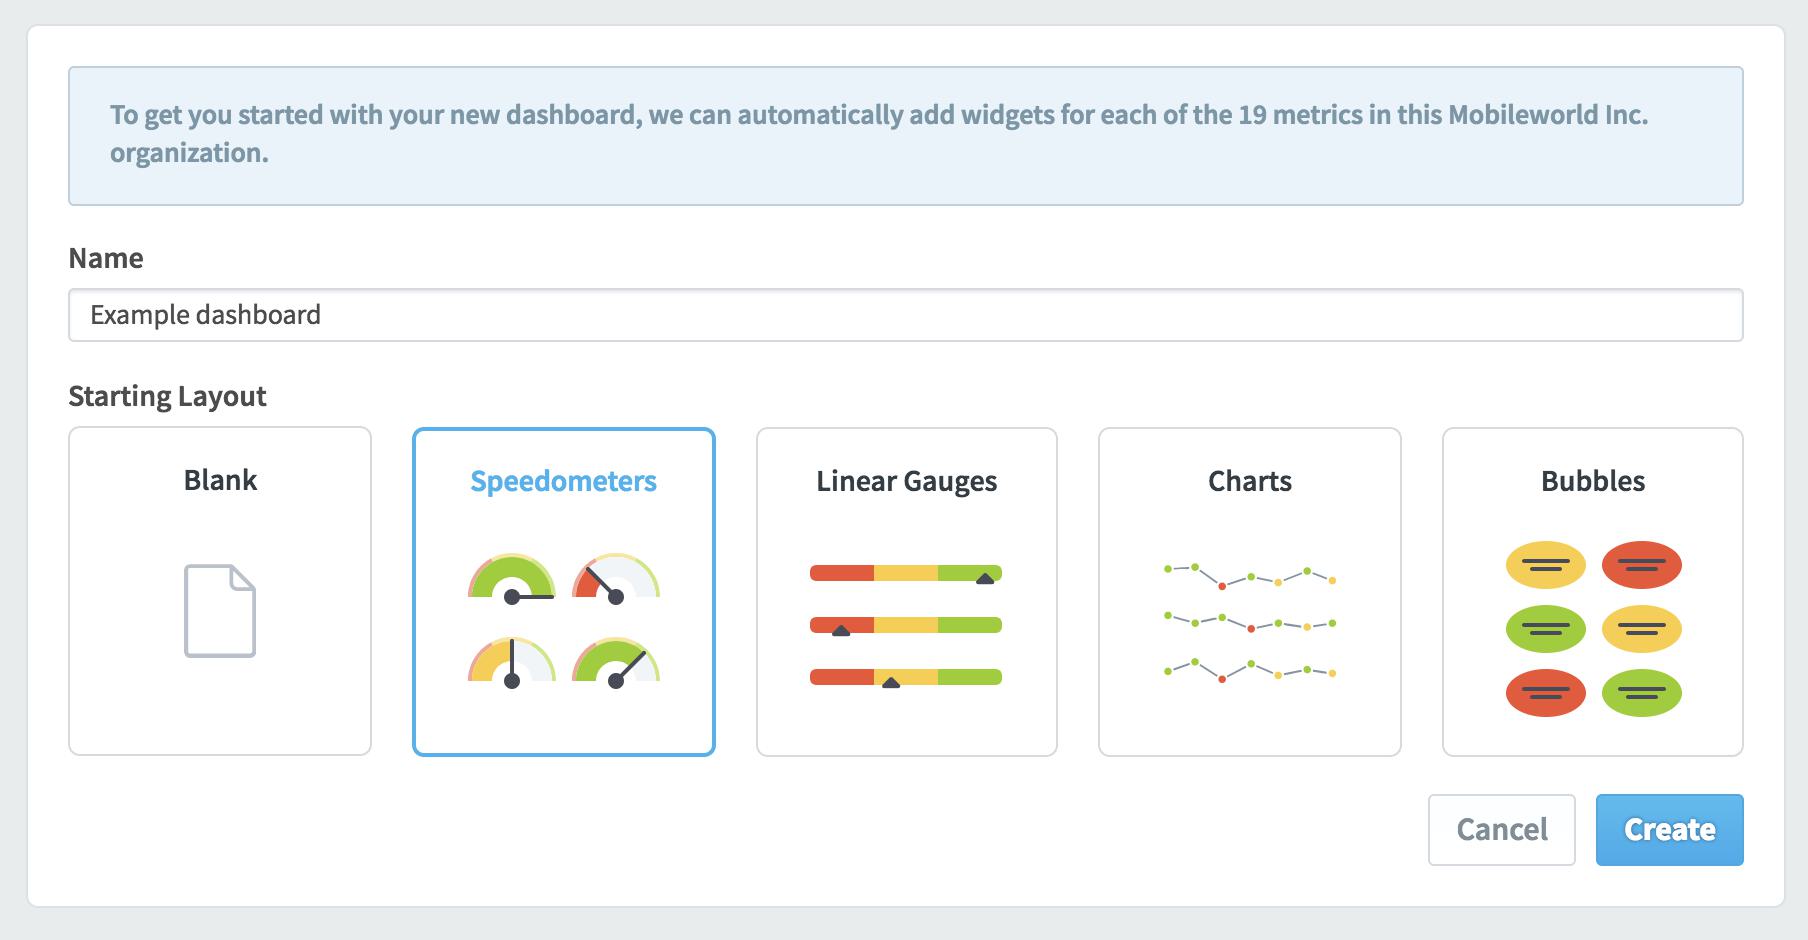
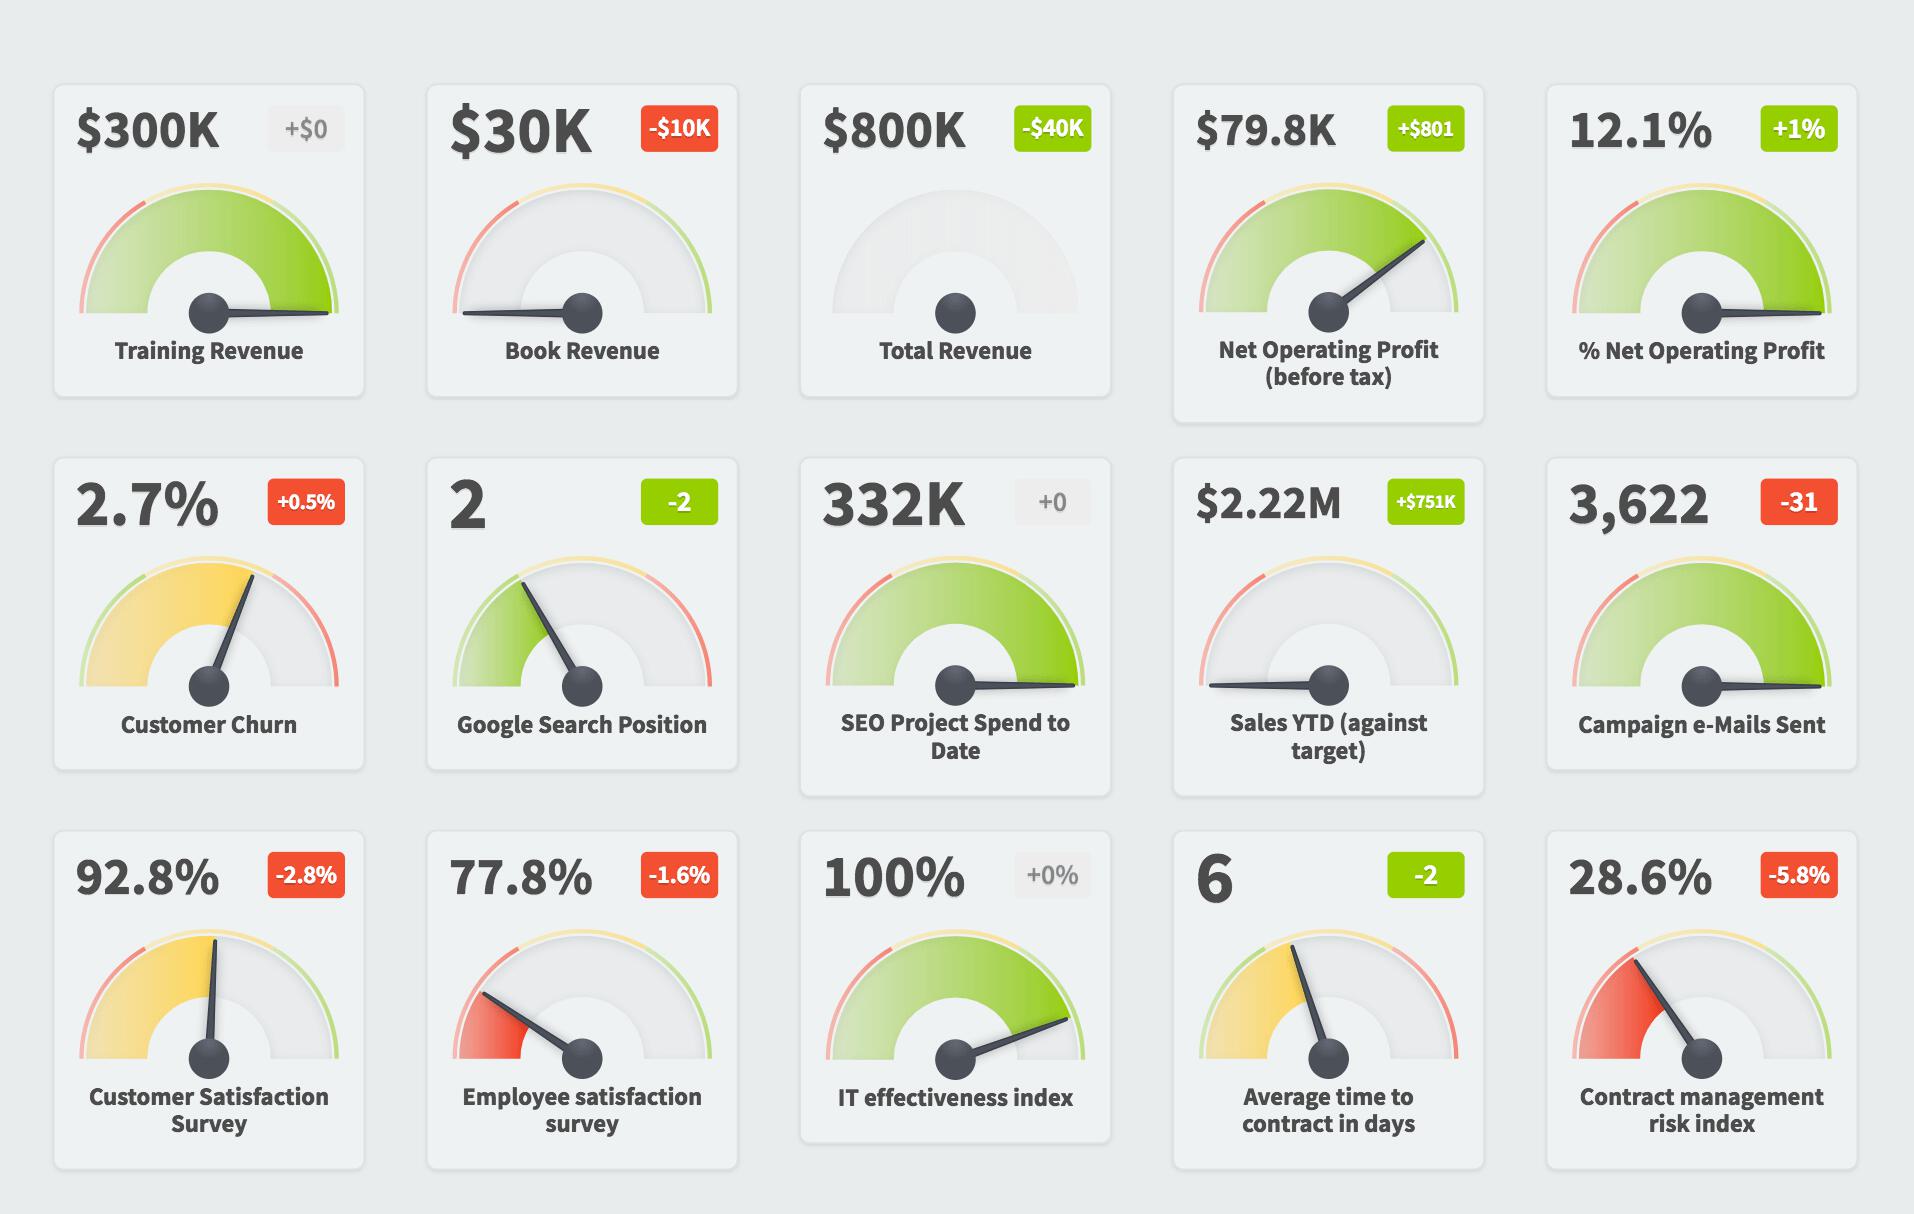
In this example, we’ve selected speedometers, and when you click “create,” the new dashboard starts with a speedometer for every KPI in the organization.
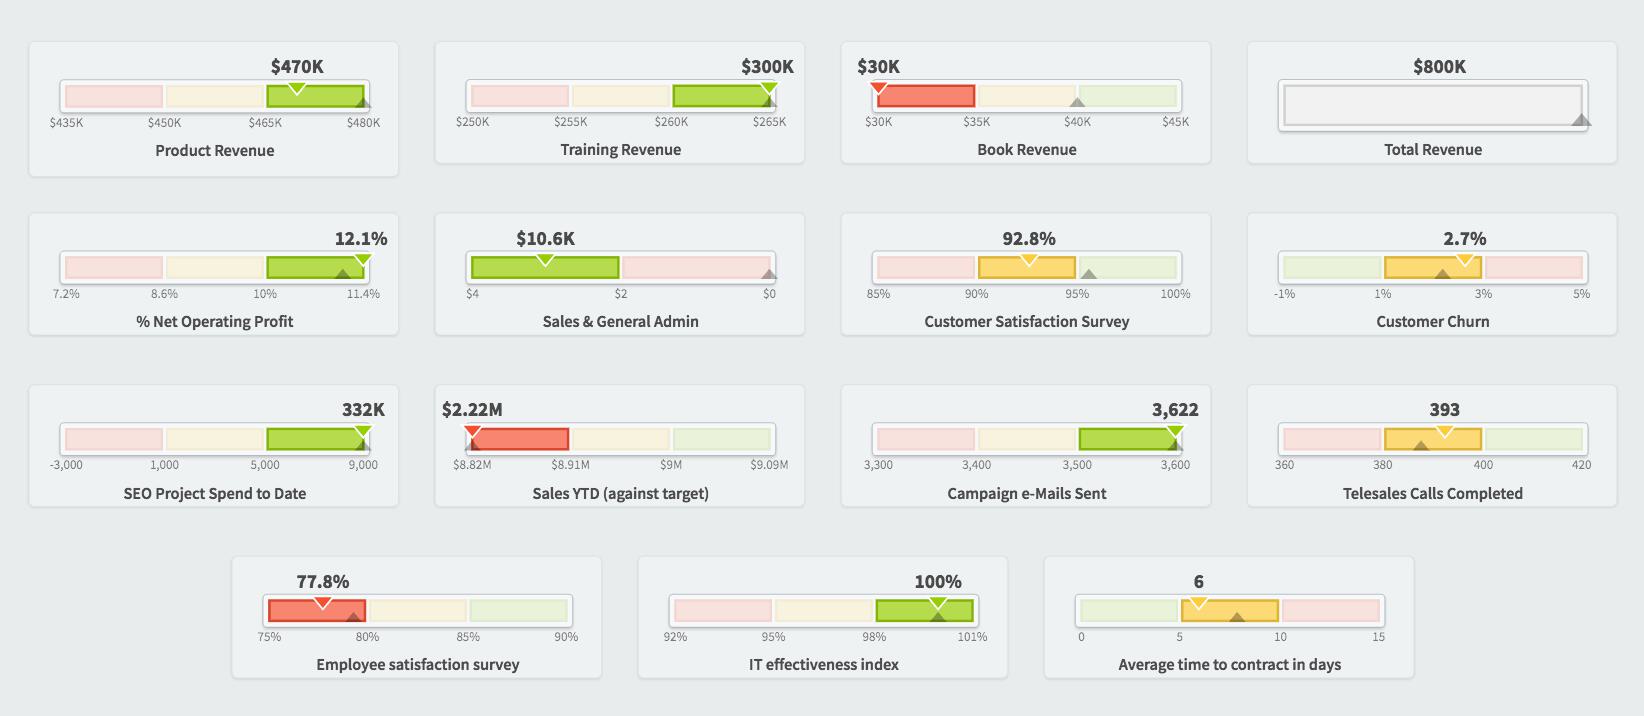
This is what the dashboard would have looked like if we chose linear gauges.
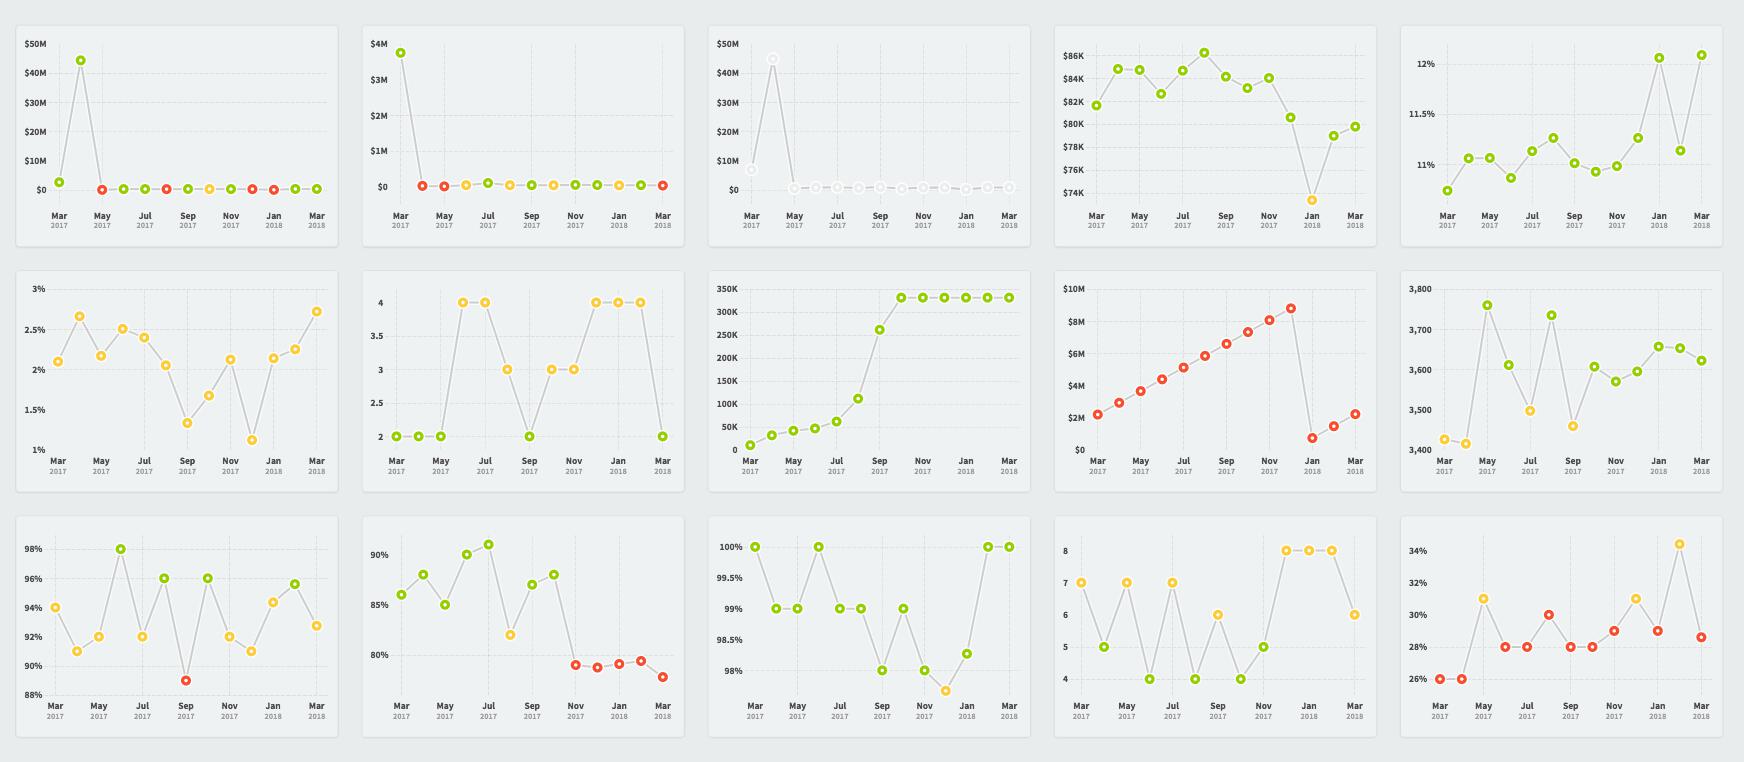
Here’s charts.
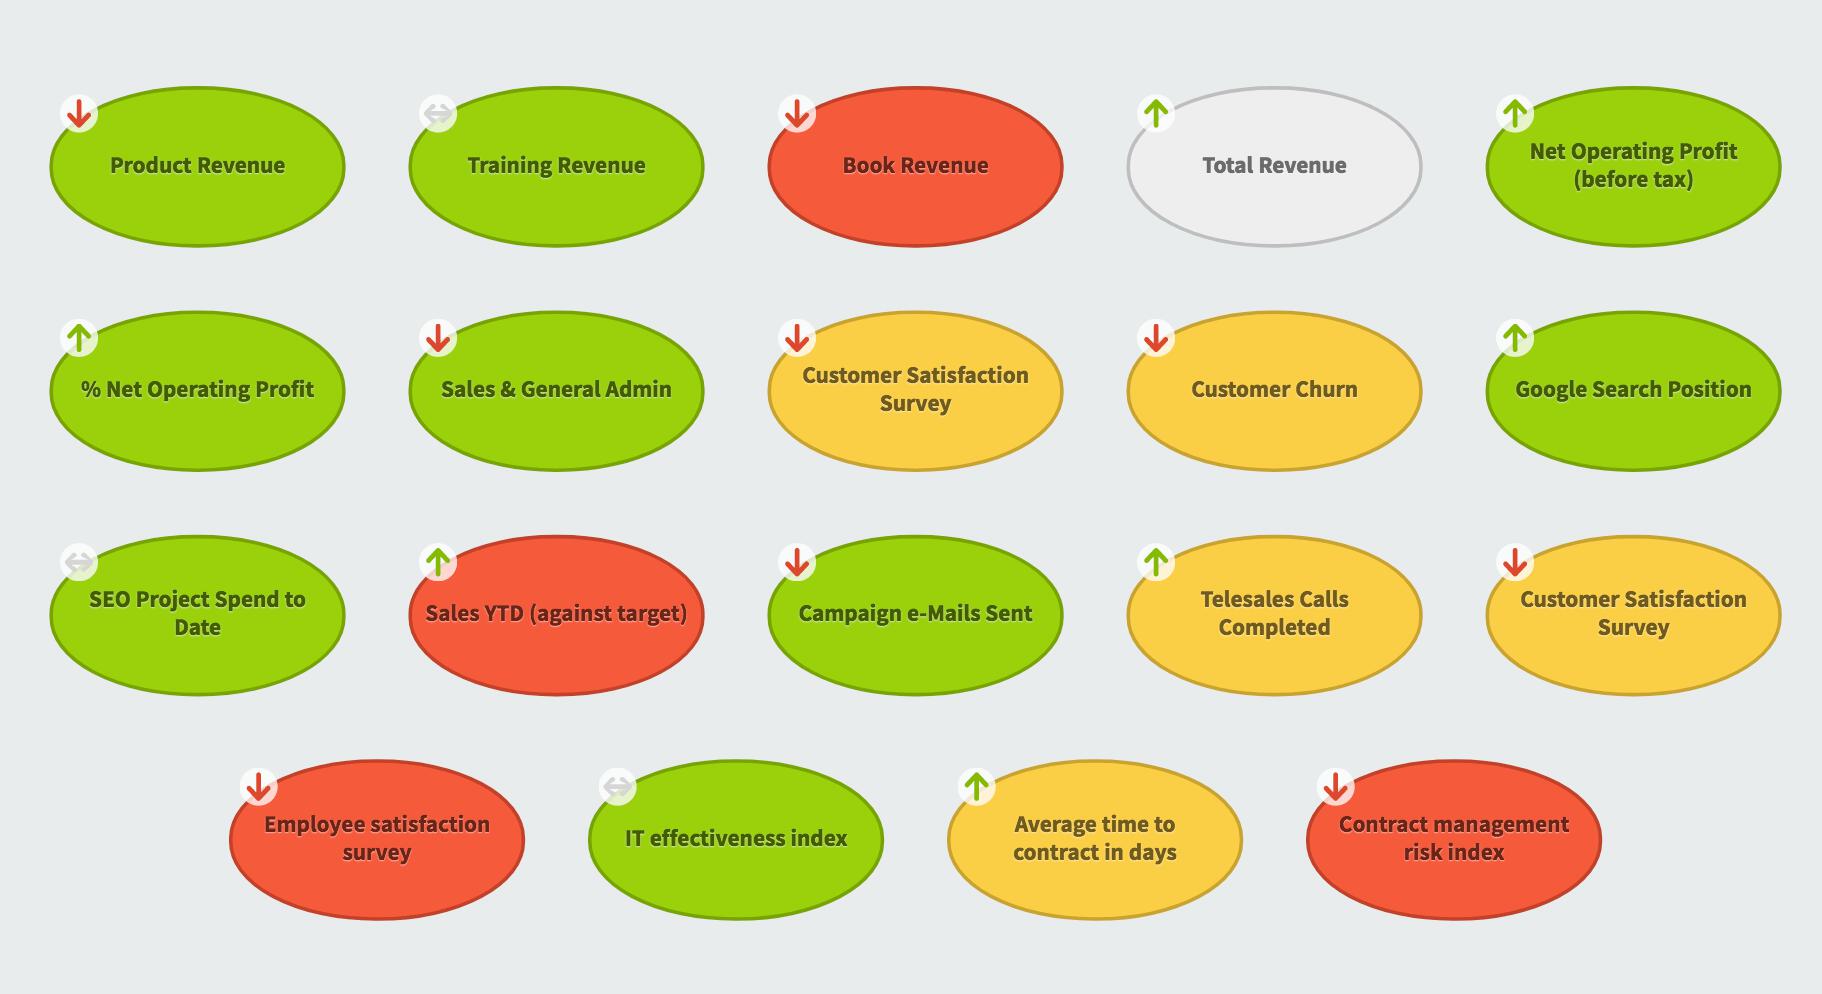
And finally, bubbles.


Experience Spider Impact for Free
Schedule a live demo or claim your free 30-day trial. We’re standing by to either show off Spider Impact or turn your data into a prototype for free.