Better Single-period Chart Labels in 3.2
Charts
 Scott O'Reilly
October 25, 2018
Scott O'Reilly
October 25, 2018
Scott O'Reilly
October 25, 2018
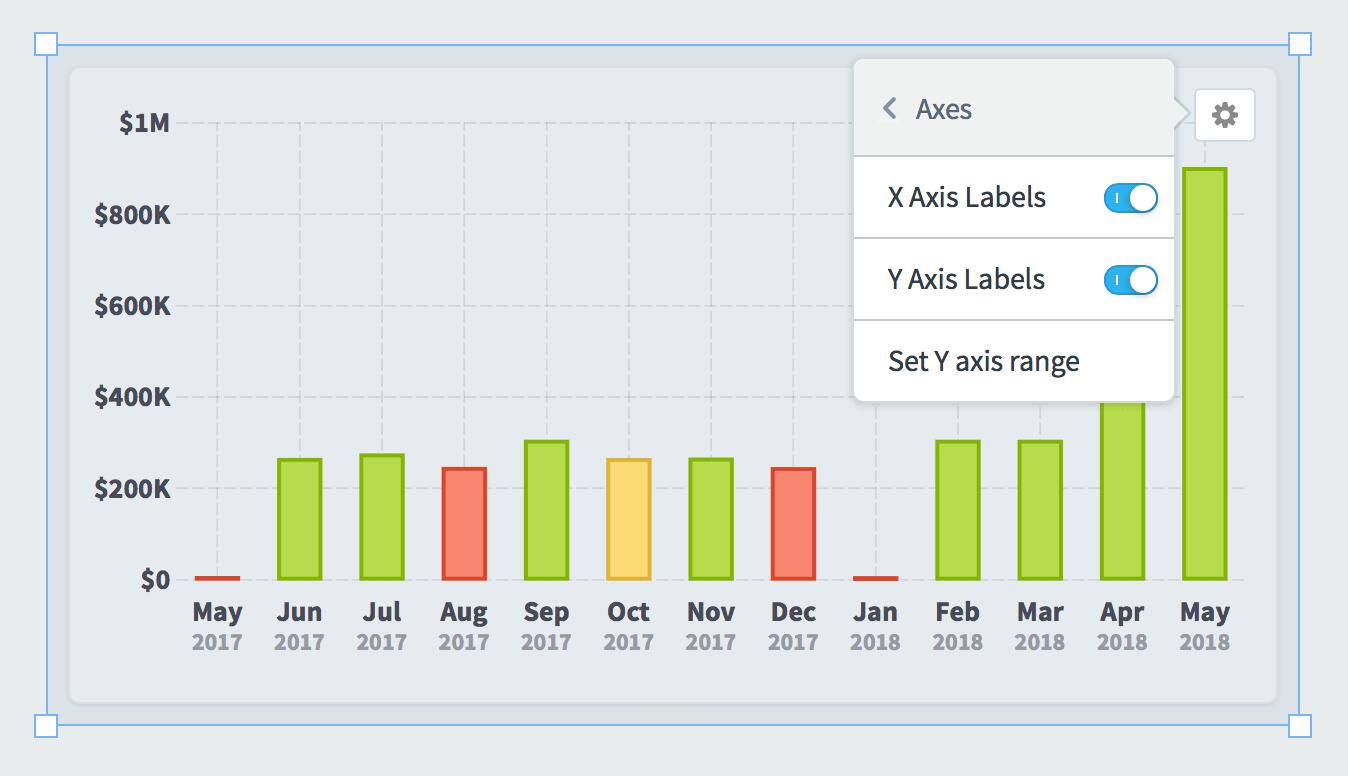
In this example we’re showing book revenue, training revenue, and product revenue for four months.
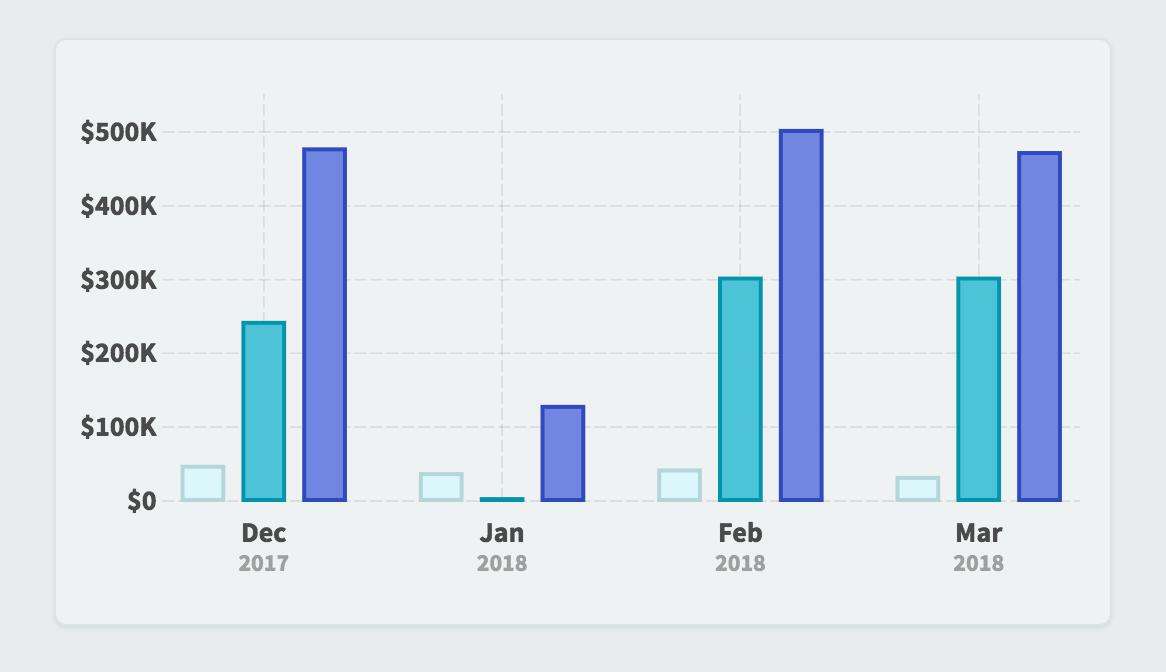
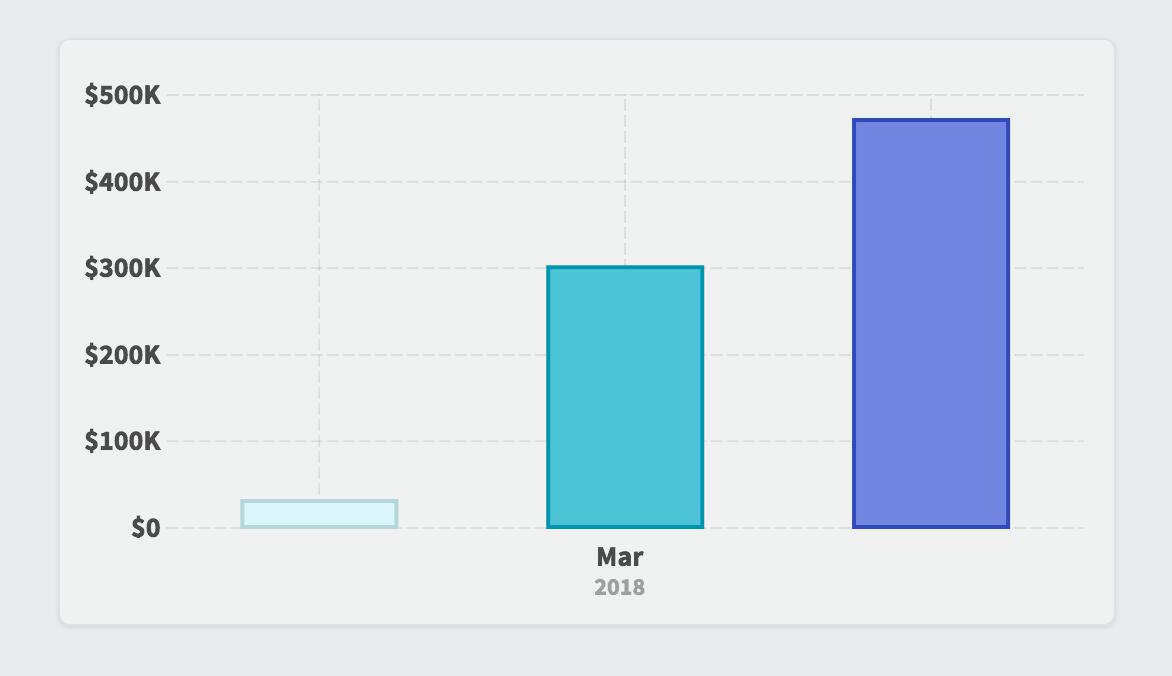
In previous versions of Scoreboard and QuickScore, if you were to change the chart to only show data for March 2018, it would show only those three bars, but it would continue to have just the one label underneath them showing the month.
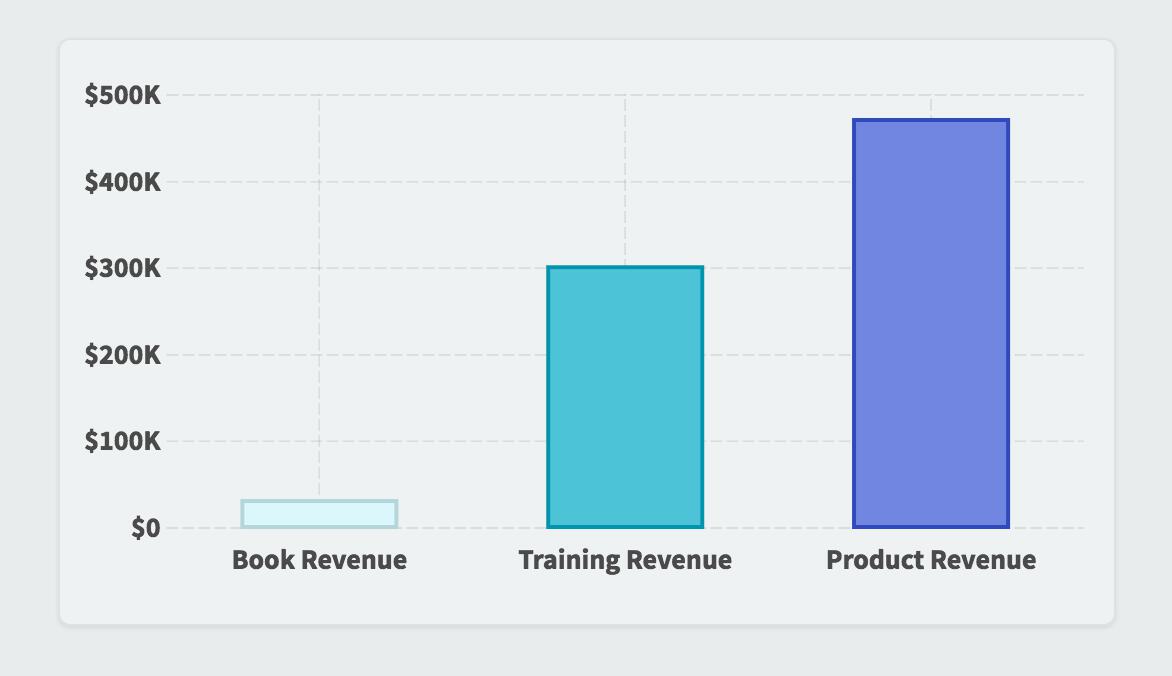
In 3.2, charts now show labels for the individual bars when a single period is showing.


Experience Spider Impact for Free
Schedule a live demo or claim your free 30-day trial. We’re standing by to either show off Spider Impact or turn your data into a prototype for free.