Chart Writer Report in 3.1
Charts
 Scott O'Reilly
February 1, 2018
Scott O'Reilly
February 1, 2018
Scott O'Reilly
February 1, 2018
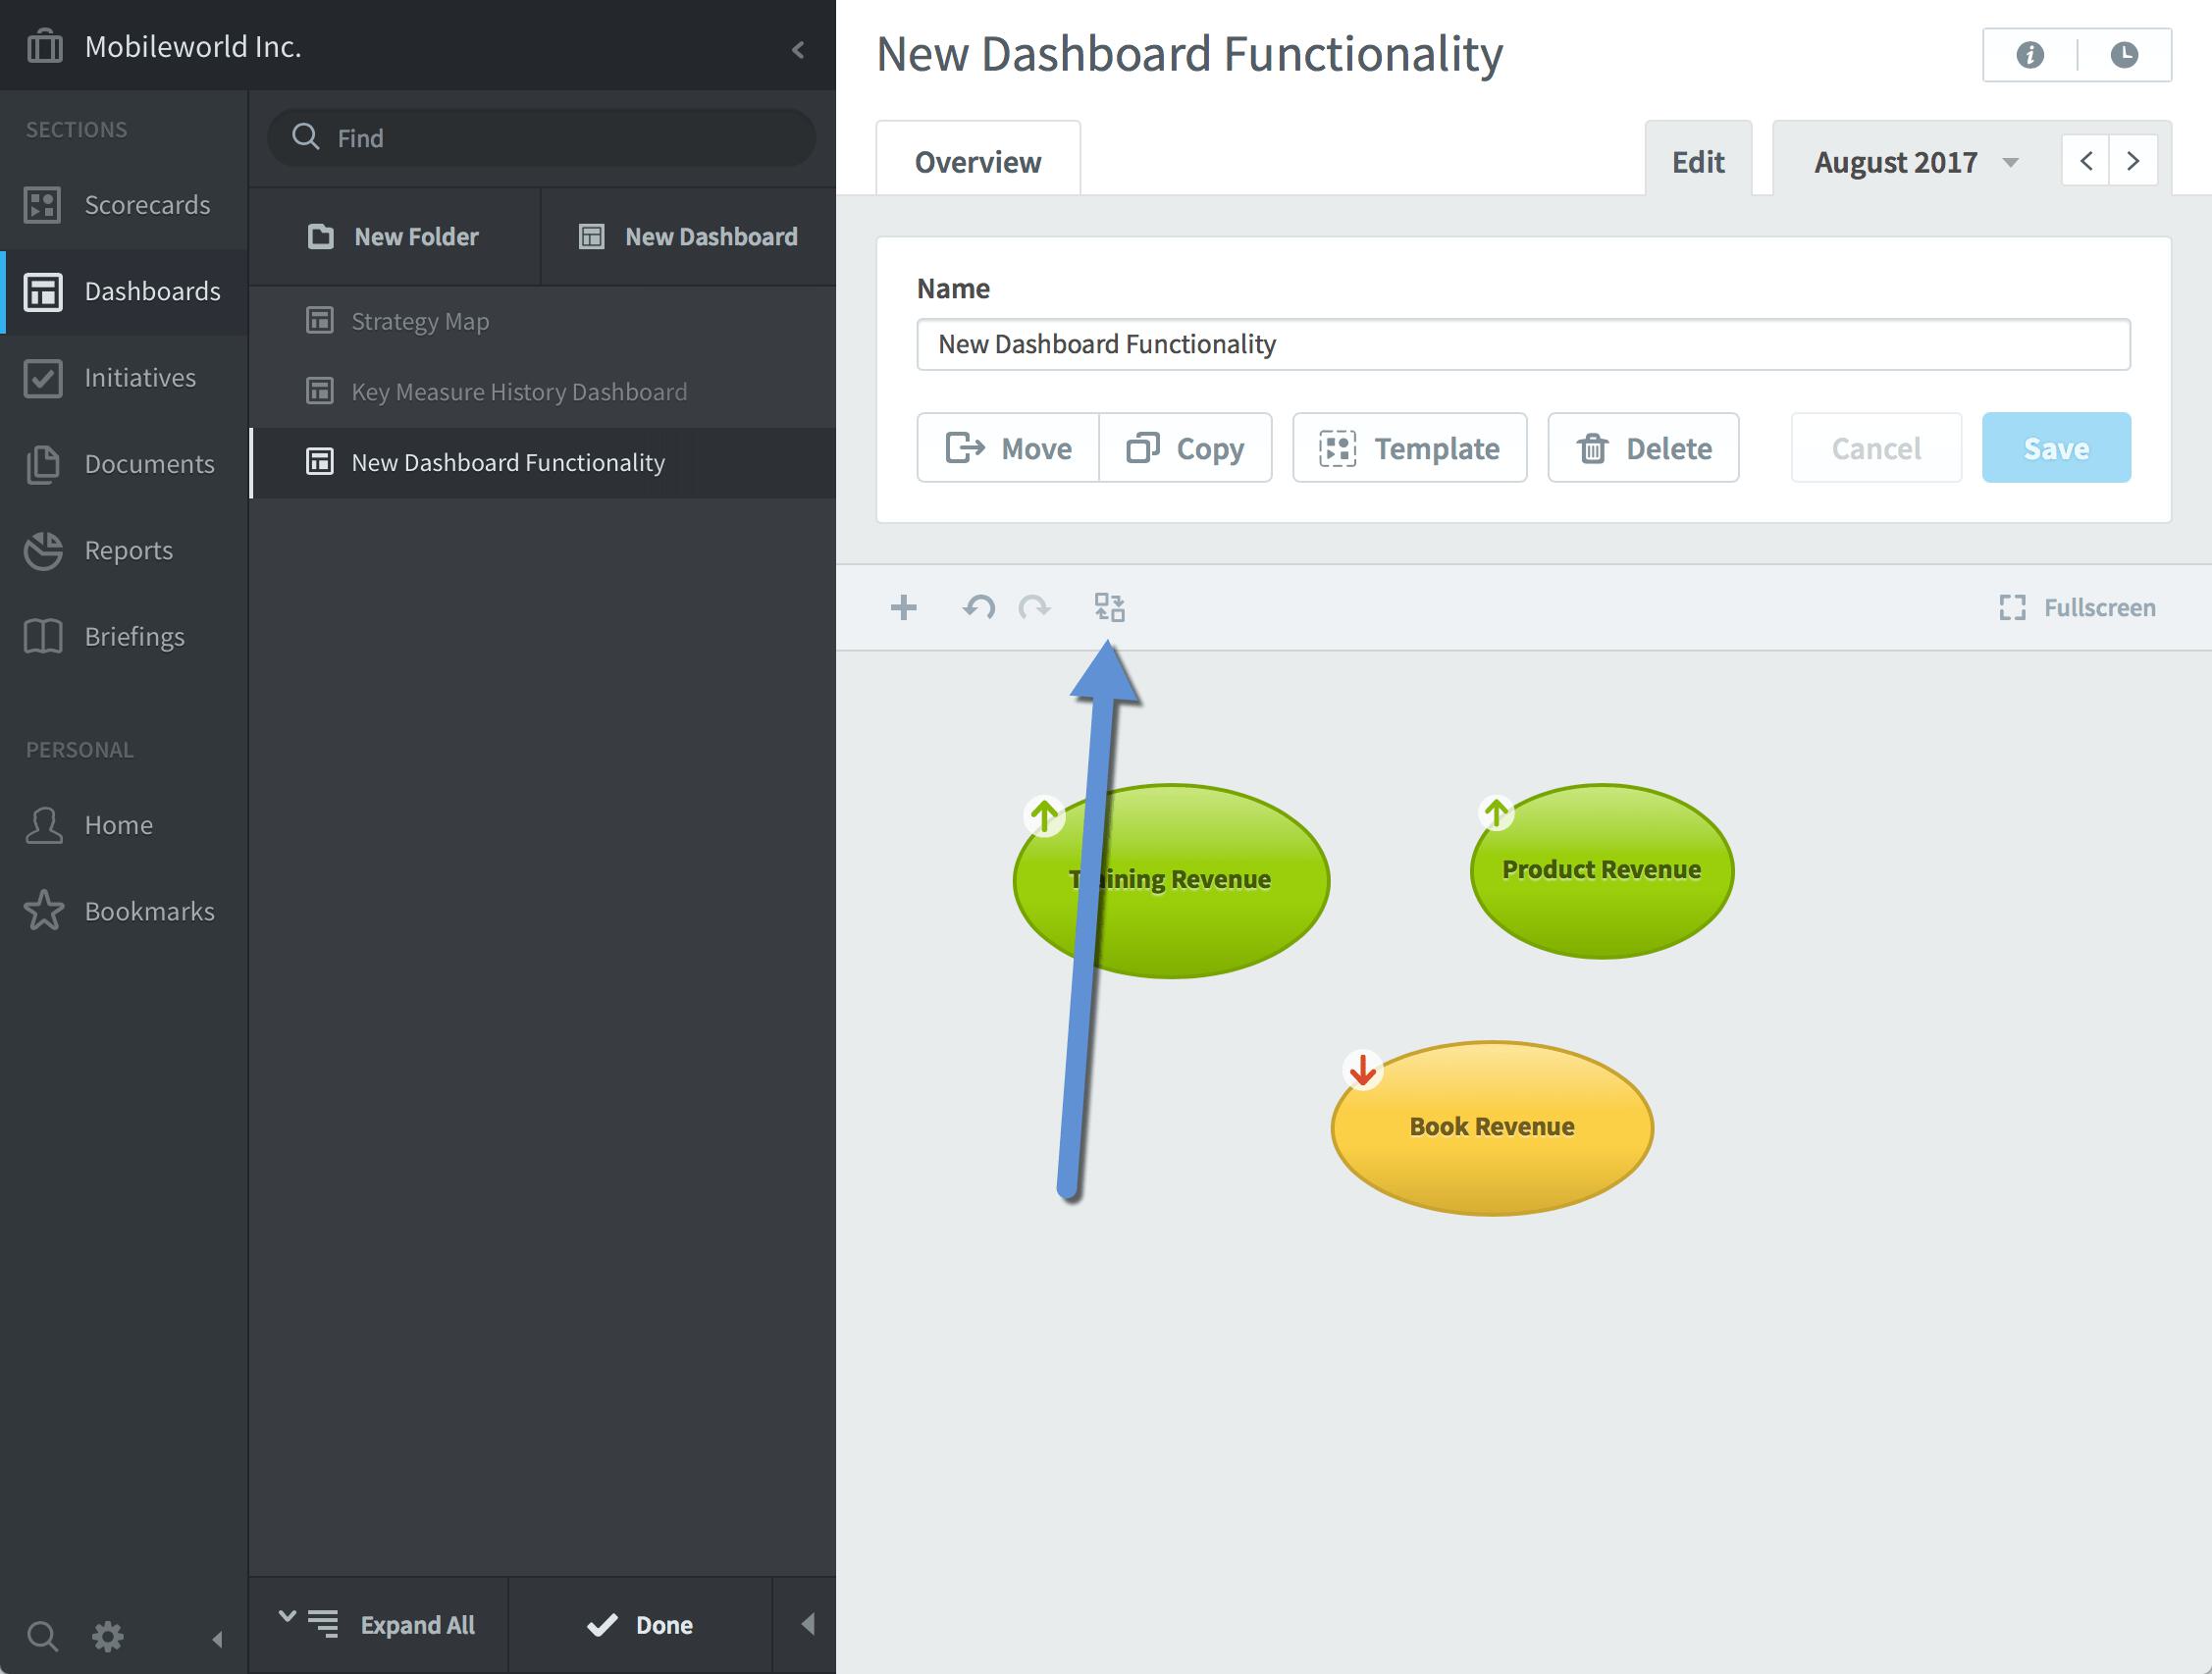
There are two new reports in version 3.1. The first one is the Chart Writer. This is the same chart that you can edit on the Scorecards Overview tab and add to dashboards.
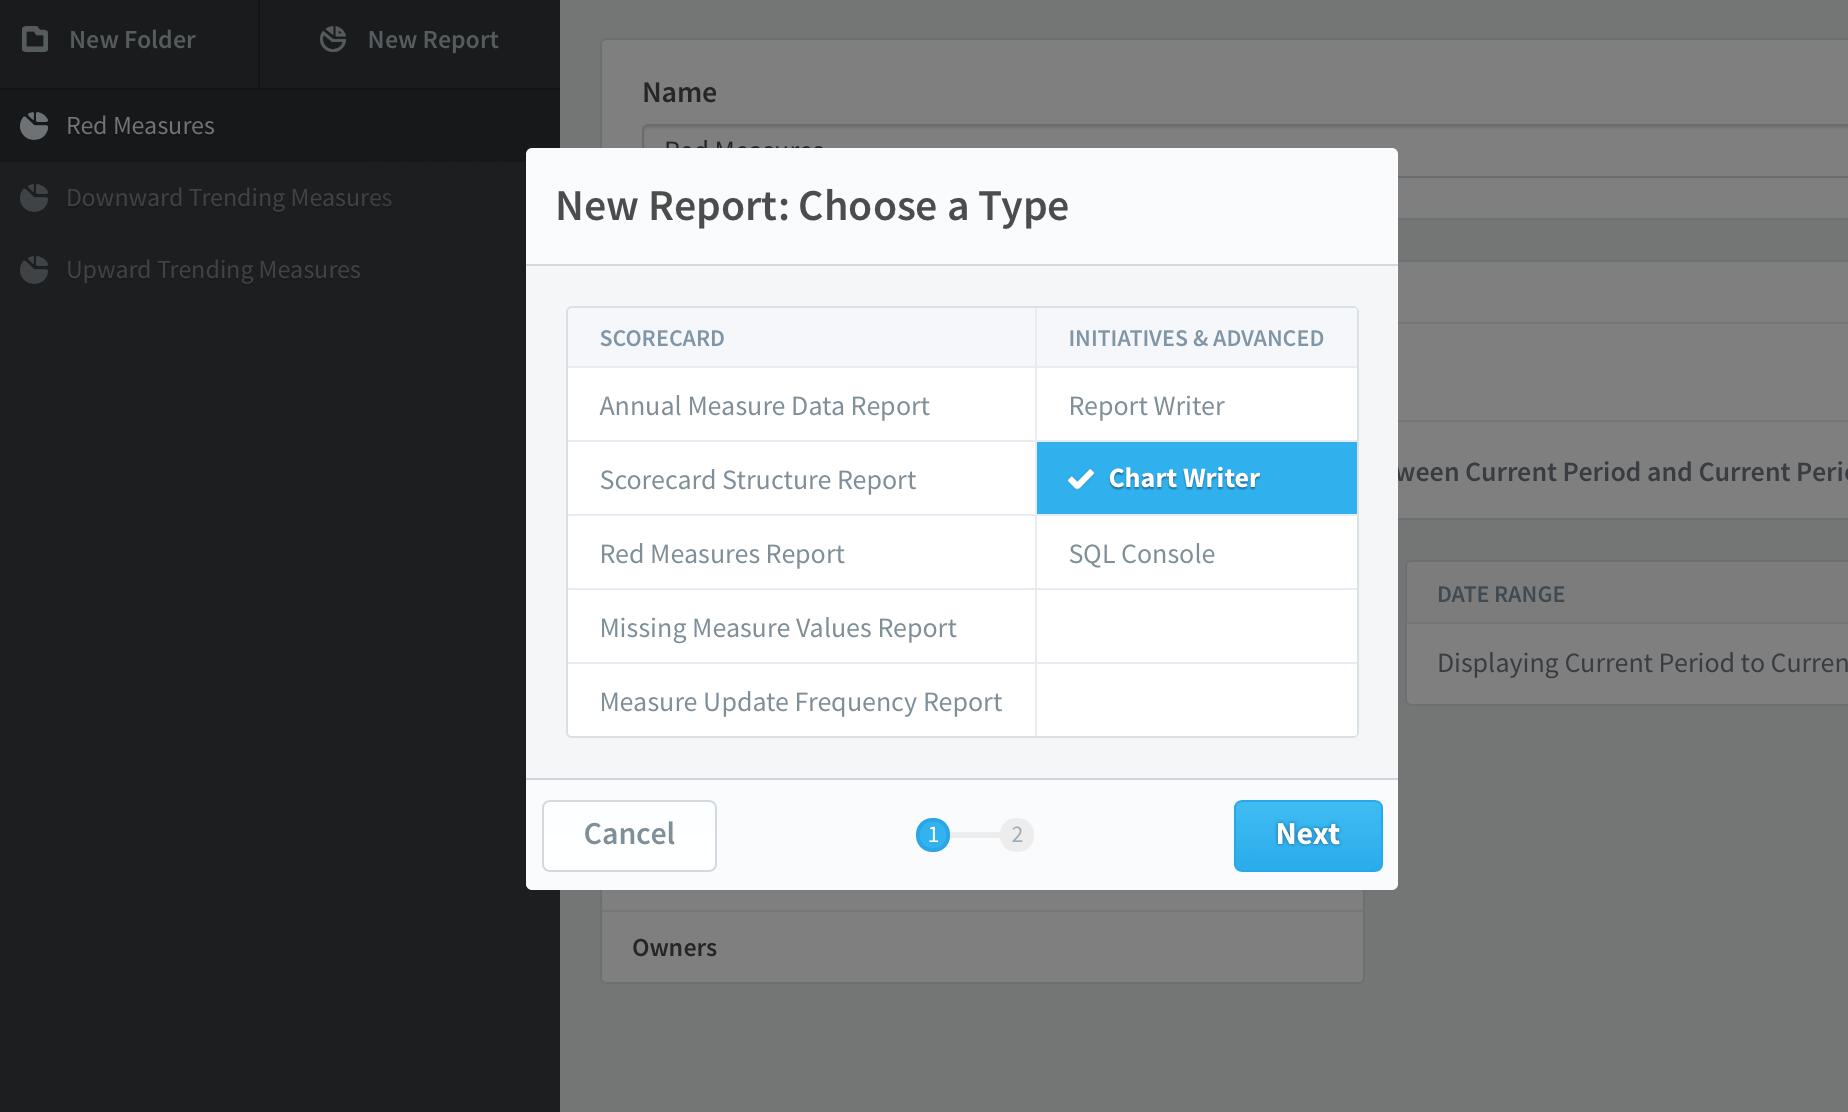
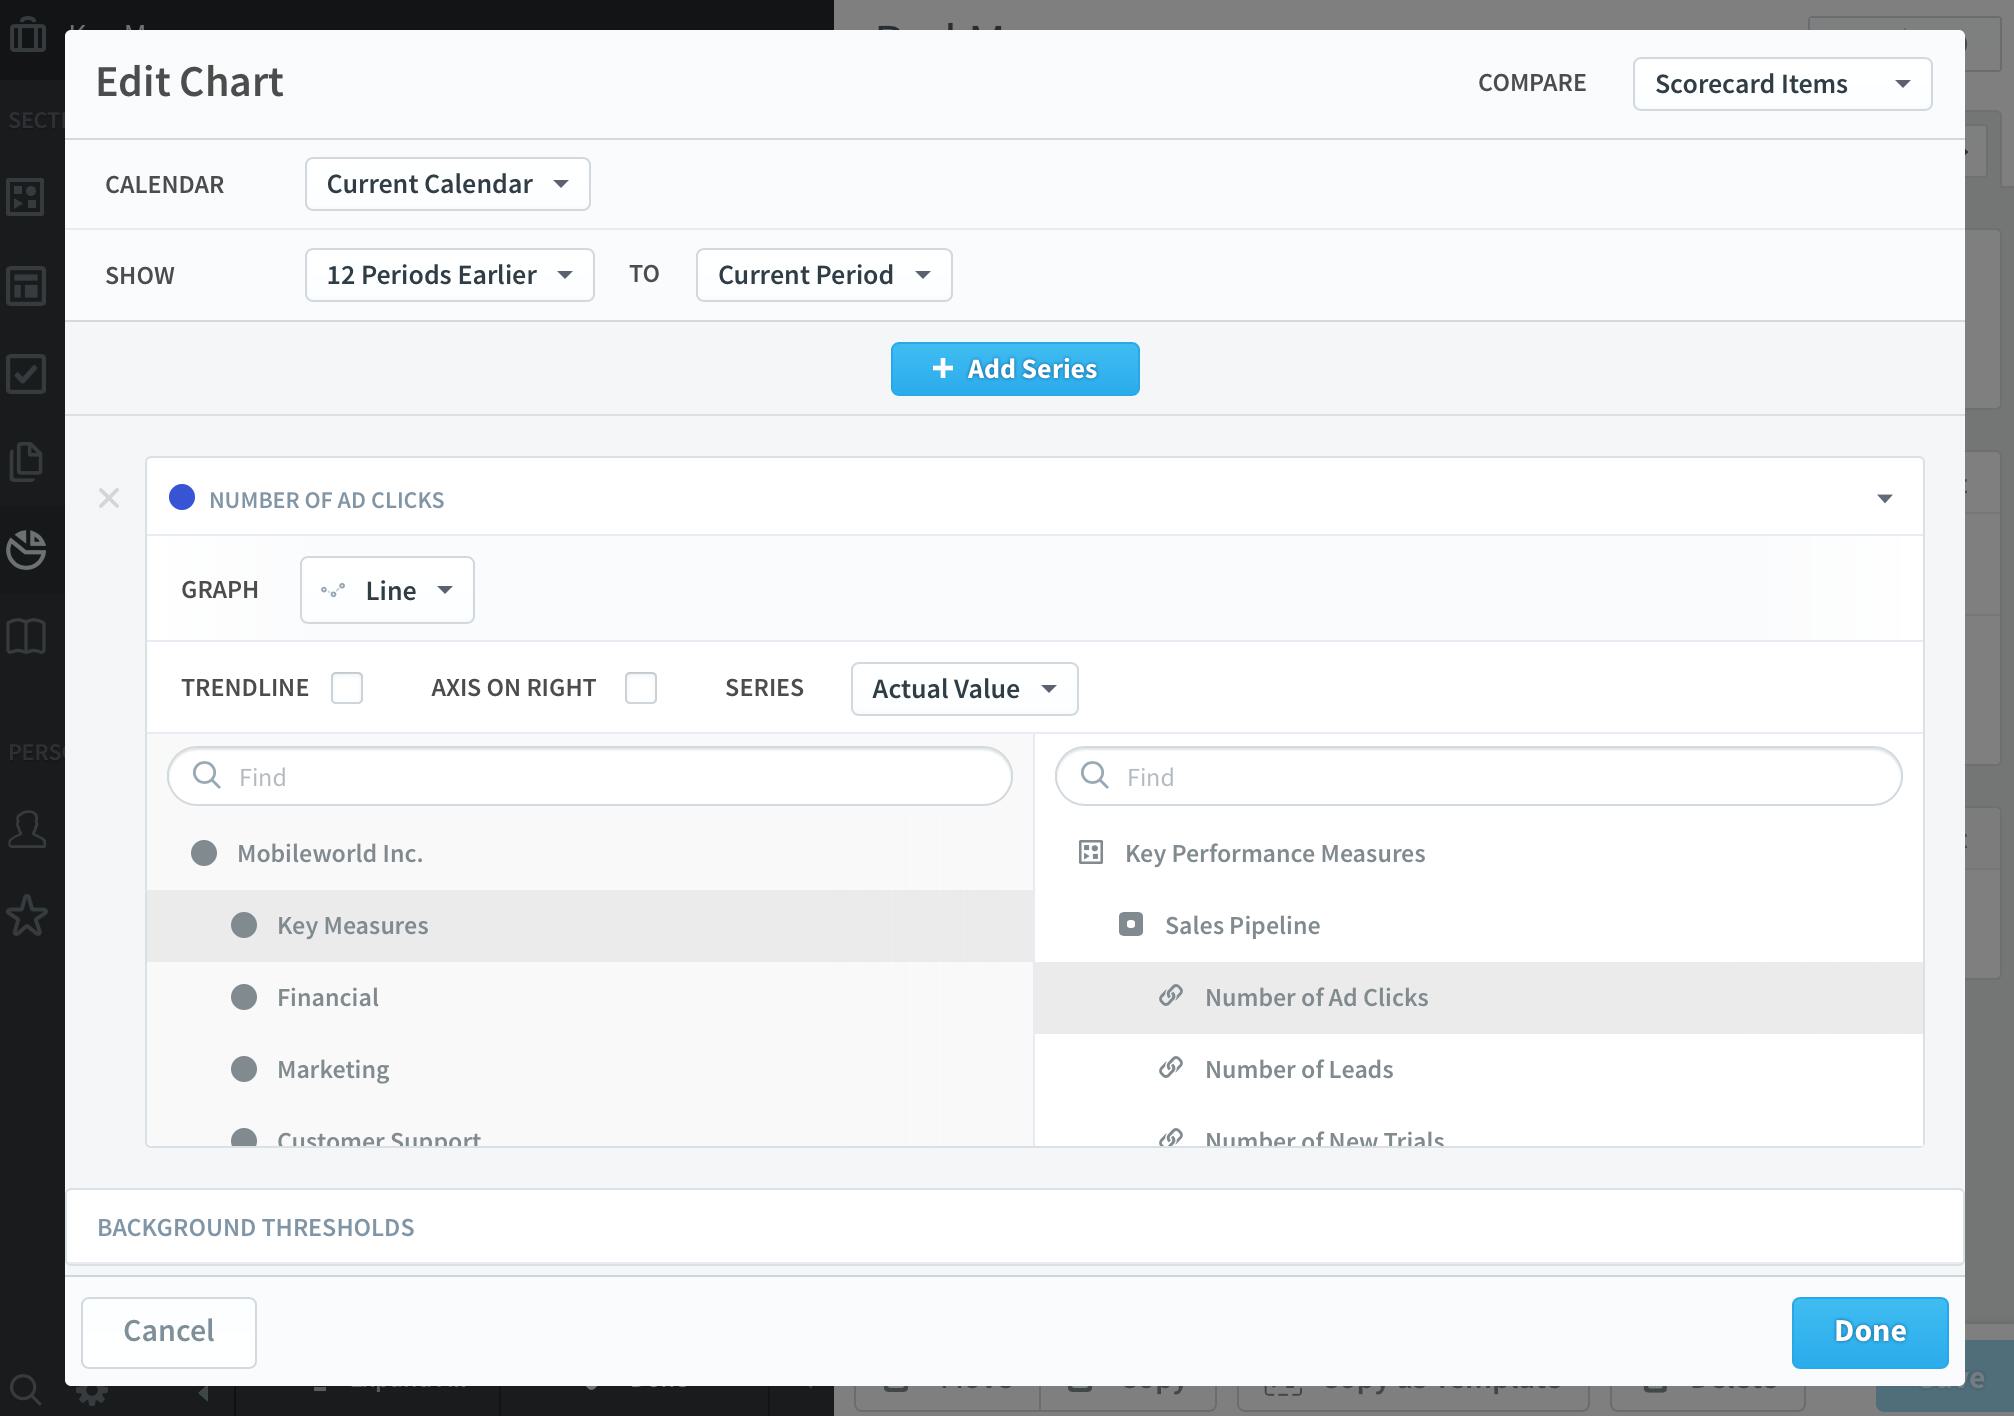
Once you choose “chart writer” for your report type, you can add one or more series to your chart and determine what kind of chart it will be.
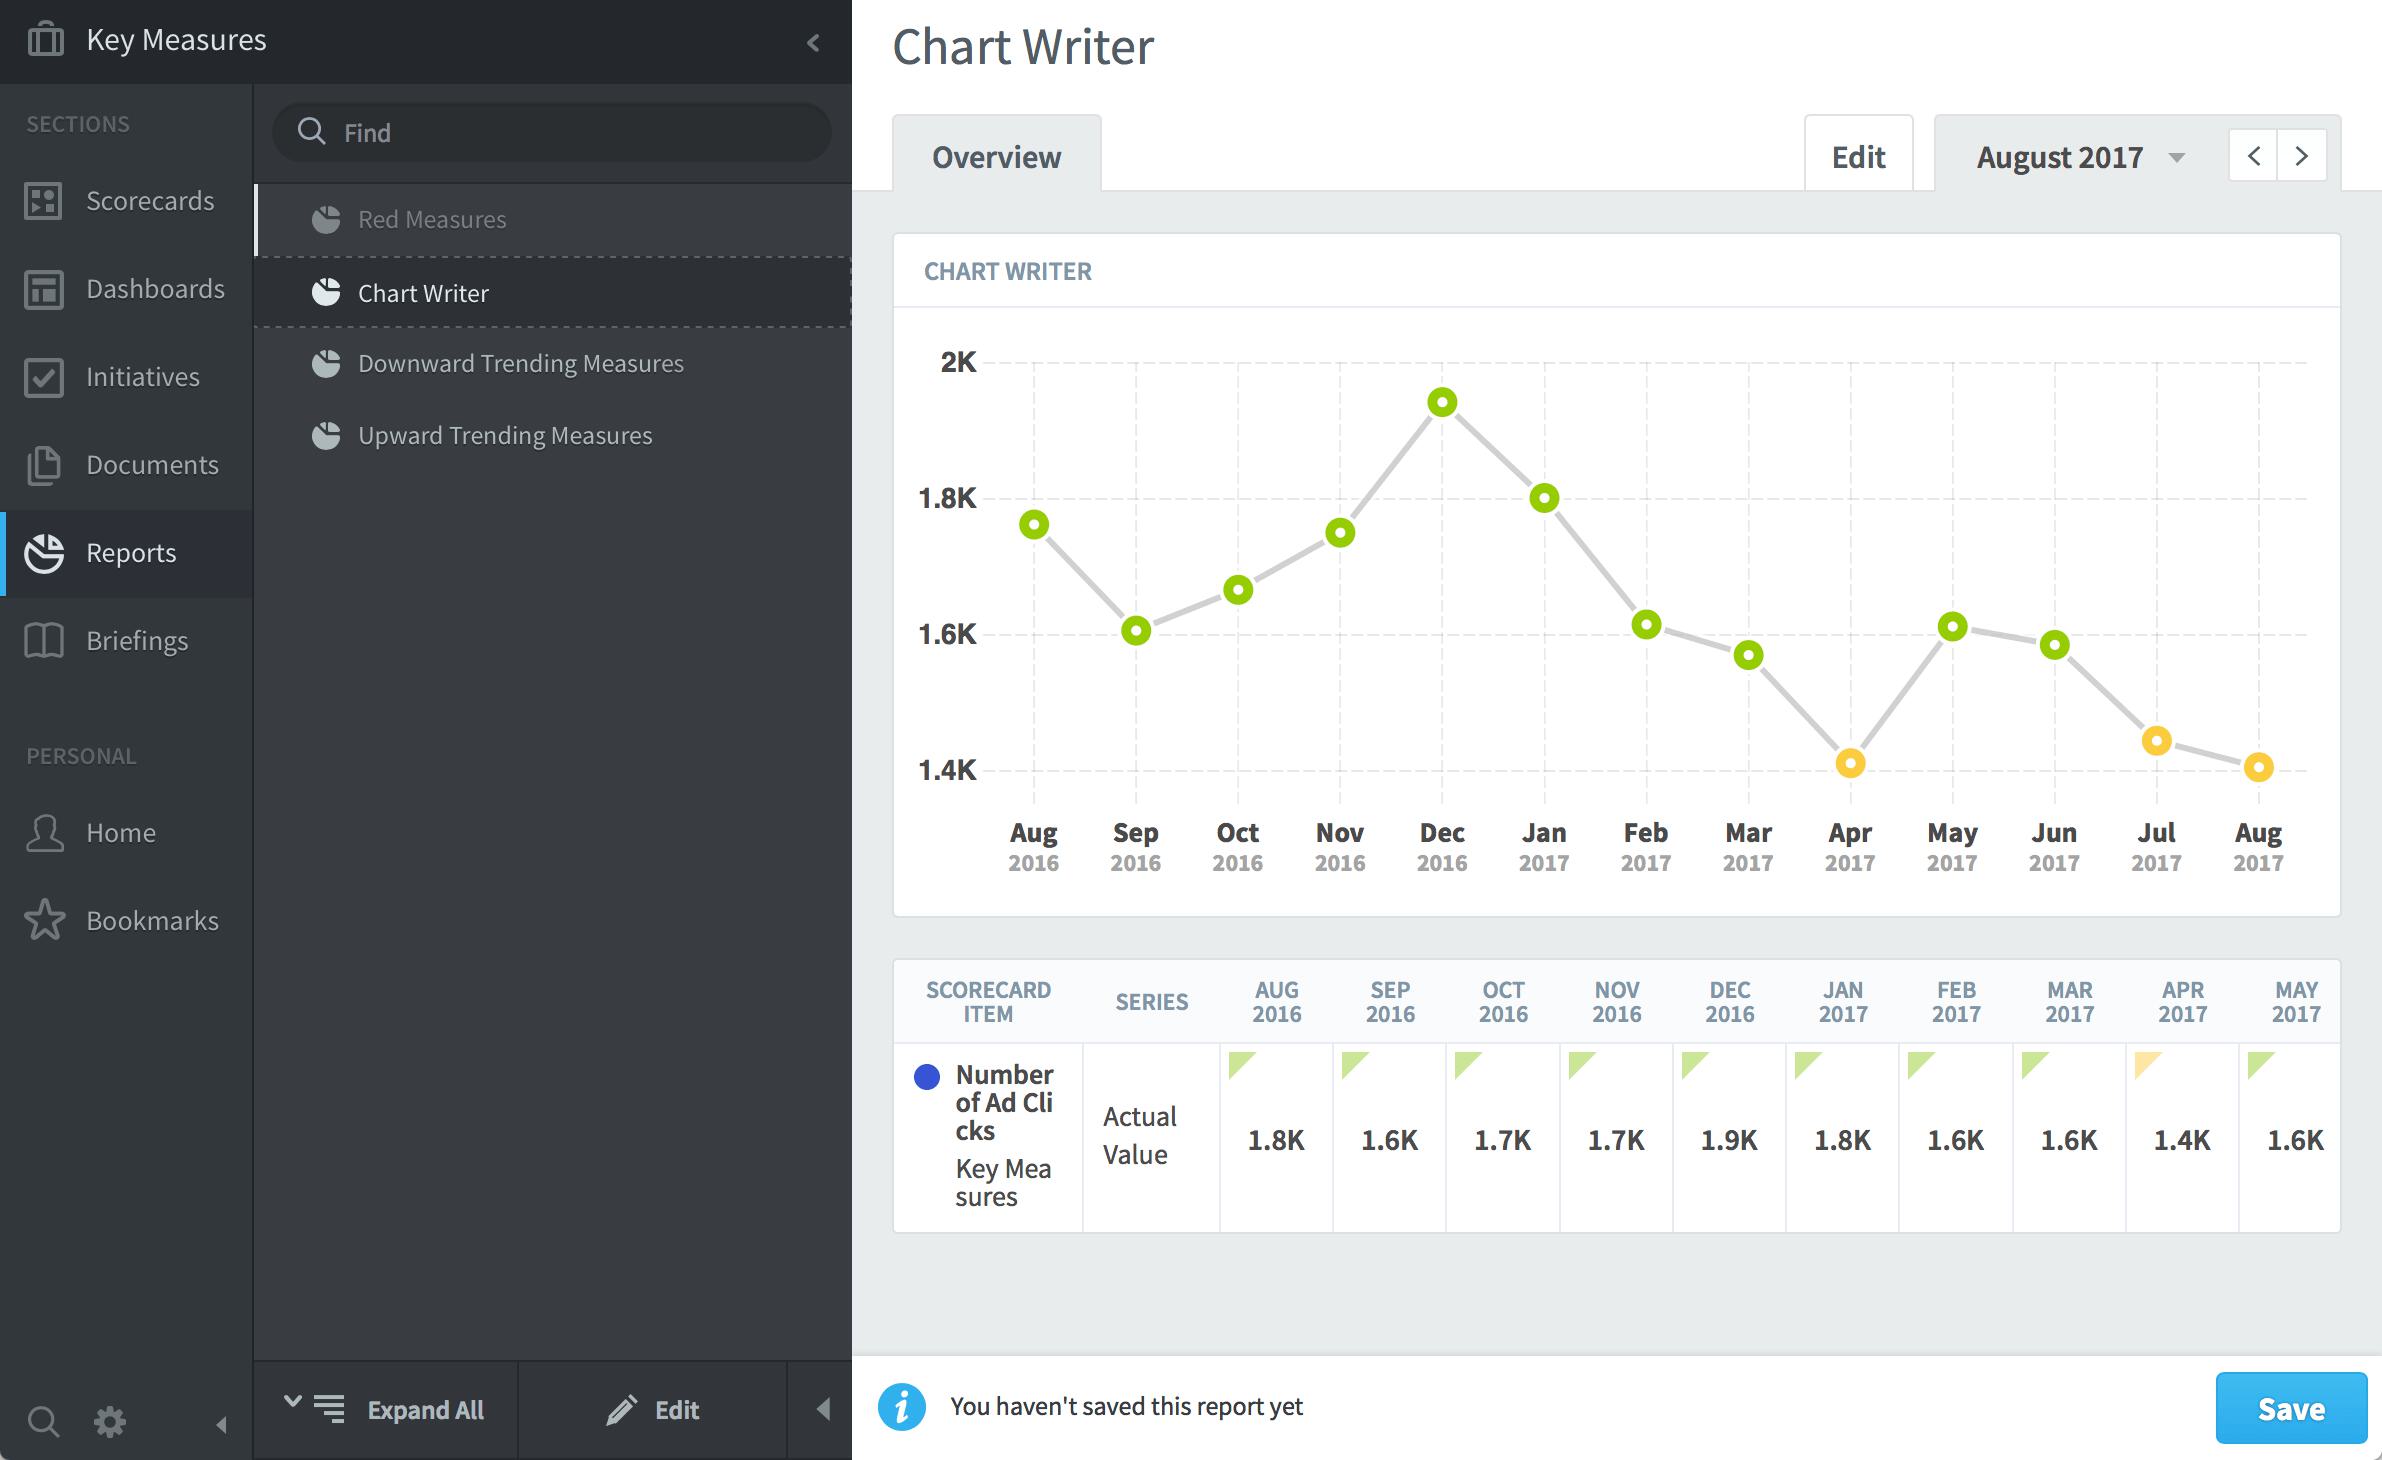
When you’re done, you have a chart in the reports section that can be saved and shared with other users.


Experience Spider Impact for Free
Schedule a live demo or claim your free 30-day trial. We’re standing by to either show off Spider Impact or turn your data into a prototype for free.