Adding Initiative Objects to Dashboards in 2.13
Dashboards
 Scott O'Reilly
April 4, 2016
Scott O'Reilly
April 4, 2016
Scott O'Reilly
April 4, 2016
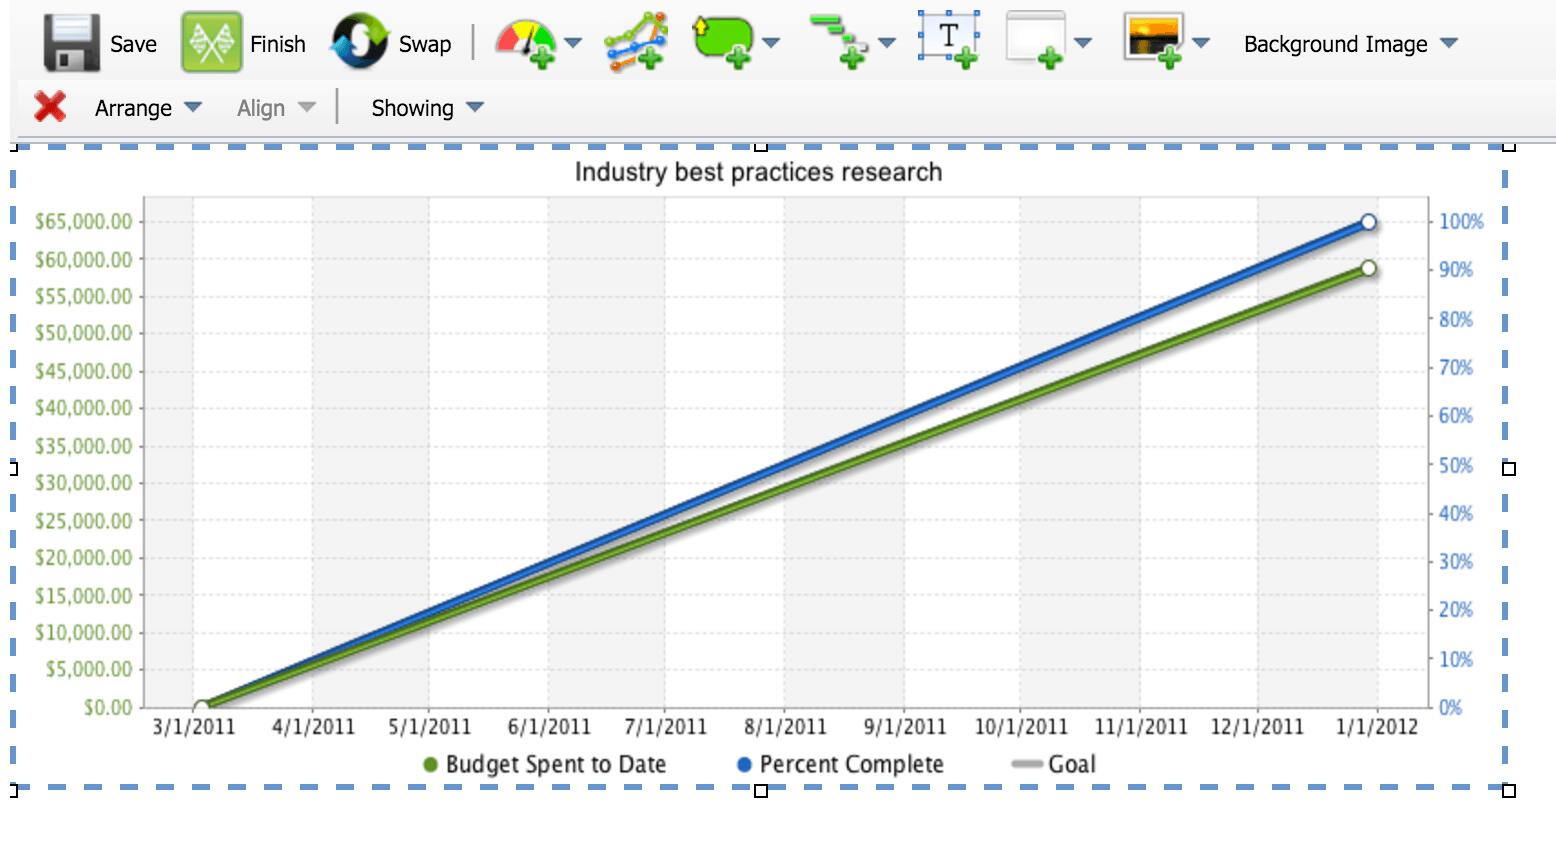
You can now add several new types of initiative objects to dashboards. One of these is the Historical Performance Chart.
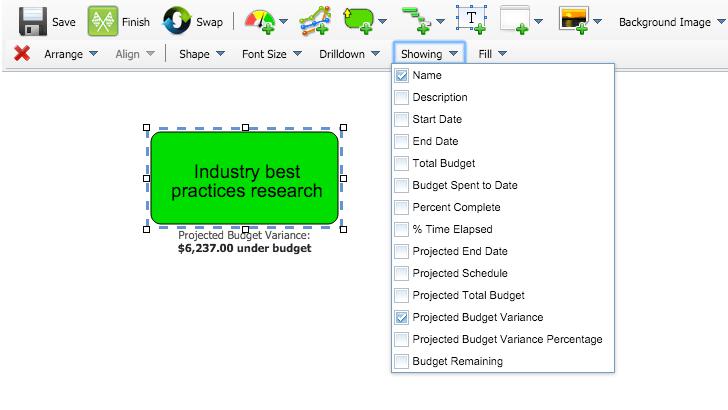
You can now also show the following initiative data as performance bubbles:
- Name
- Start Date
- End Date
- Budget
- Spent to Date
- Percent Complete
- Percent Time Elapsed
- Projected End Date
- Projected End Date Variance
- Projected Budget
- Projected Budget Variance
- Funds Remaining


Experience Spider Impact for Free
Schedule a live demo or claim your free 30-day trial. We’re standing by to either show off Spider Impact or turn your data into a prototype for free.