Initiatives Timeline Tab in 3.2
Initiatives
 Scott O'Reilly
December 10, 2018
Scott O'Reilly
December 10, 2018
Scott O'Reilly
December 10, 2018
One of the biggest new features in version 3.2 is the new Timeline tab in the Initiatives section. It shows you a fully interactive Gantt chart view of the current organization’s initiatives.
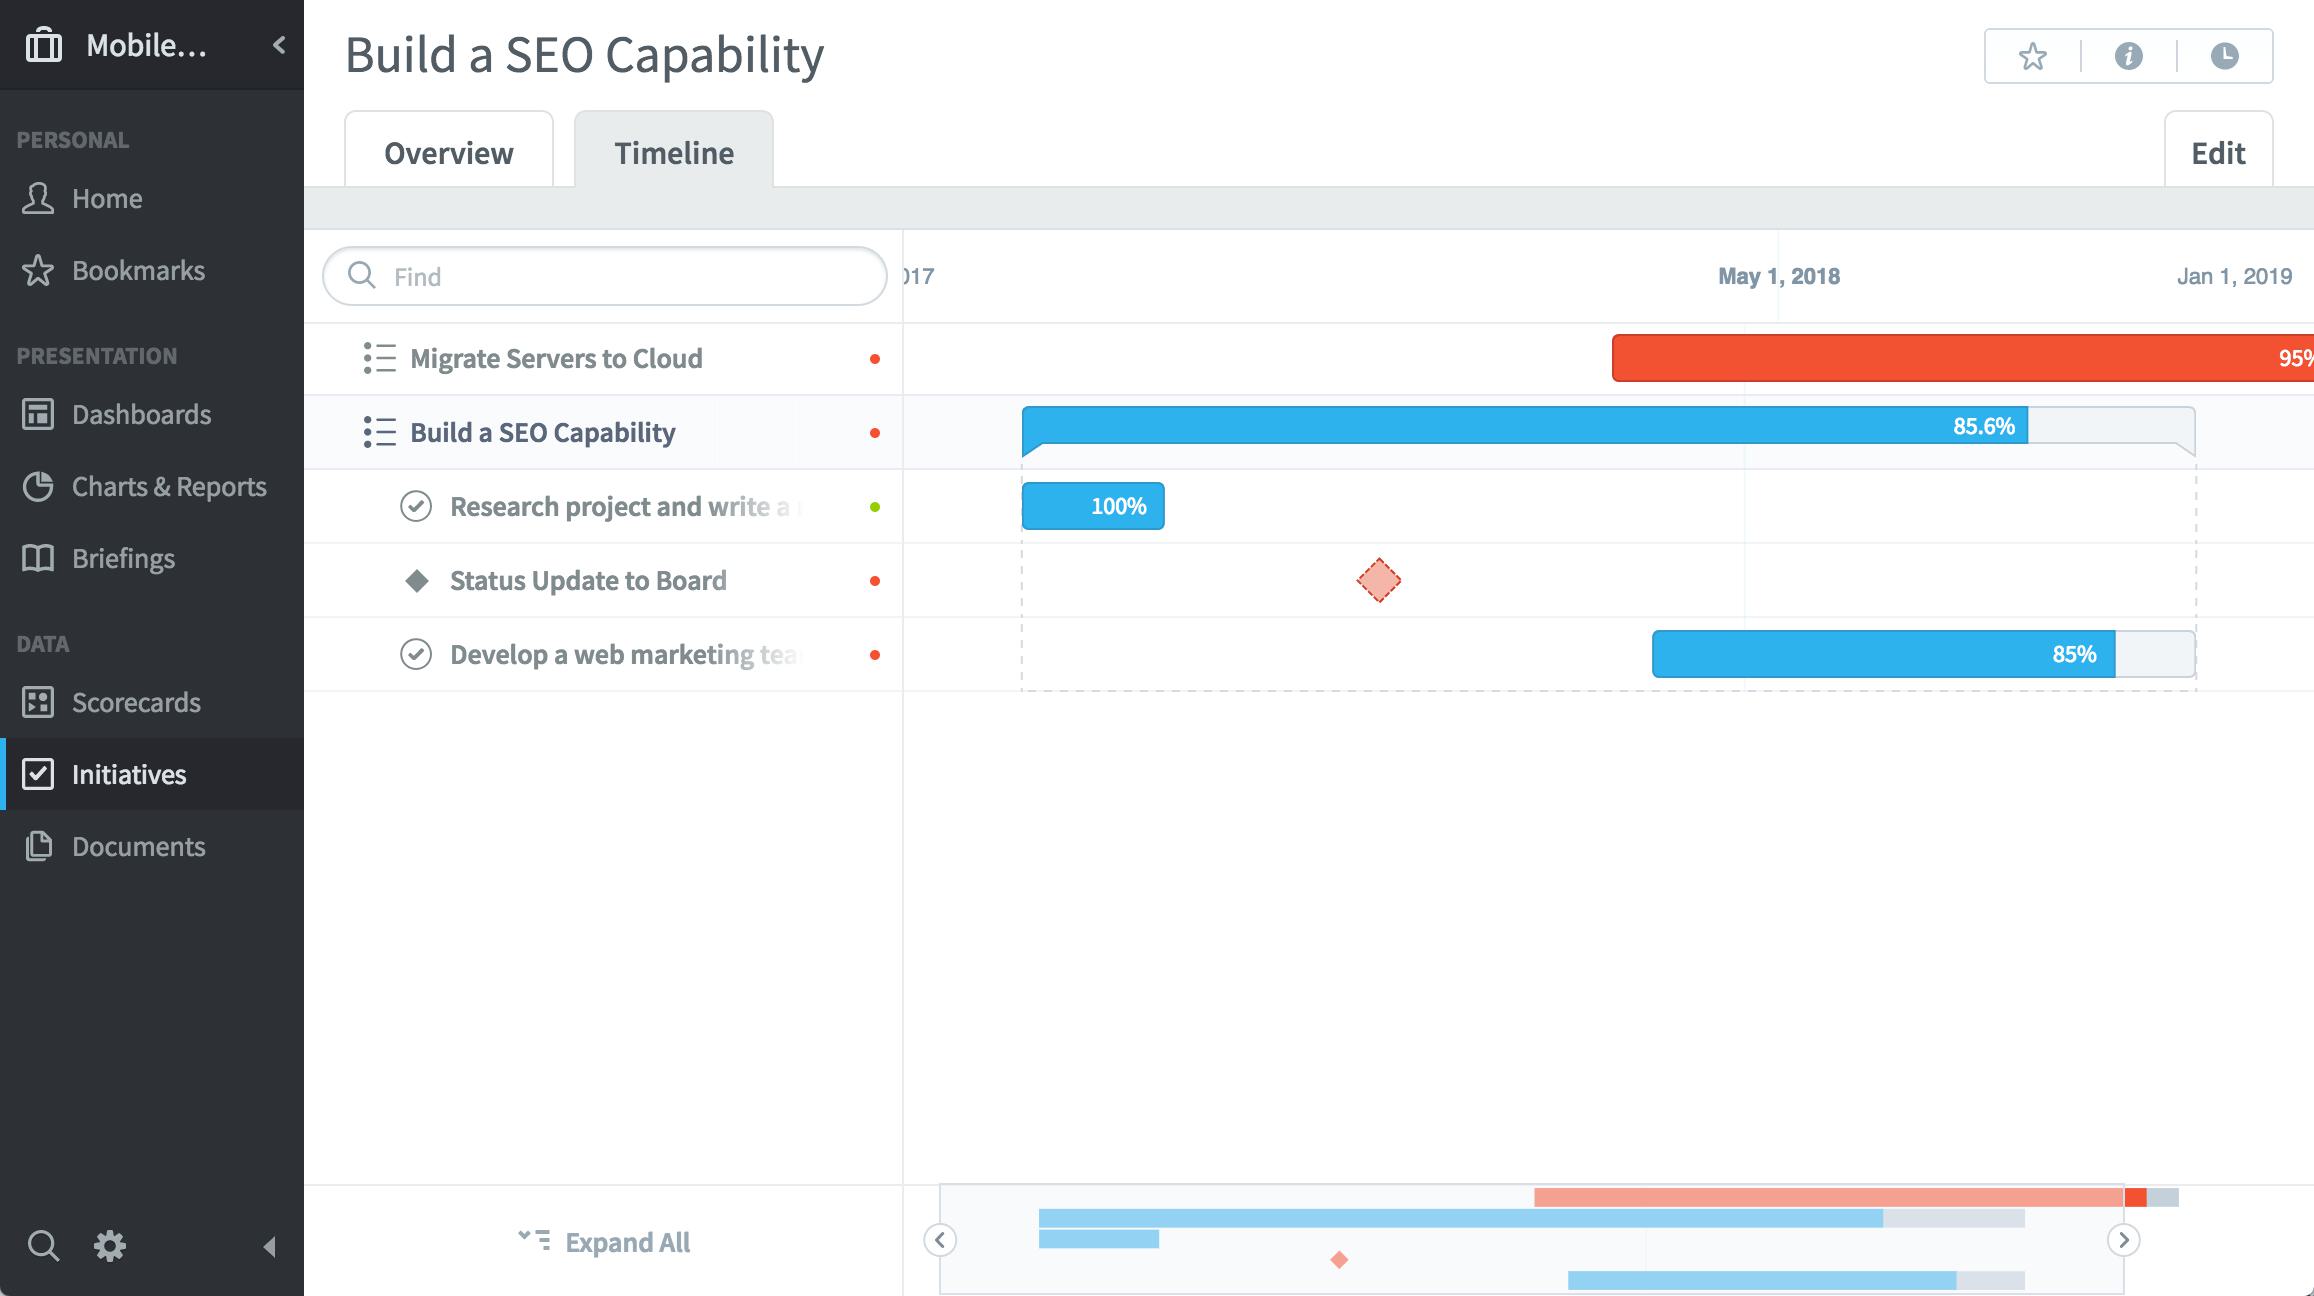
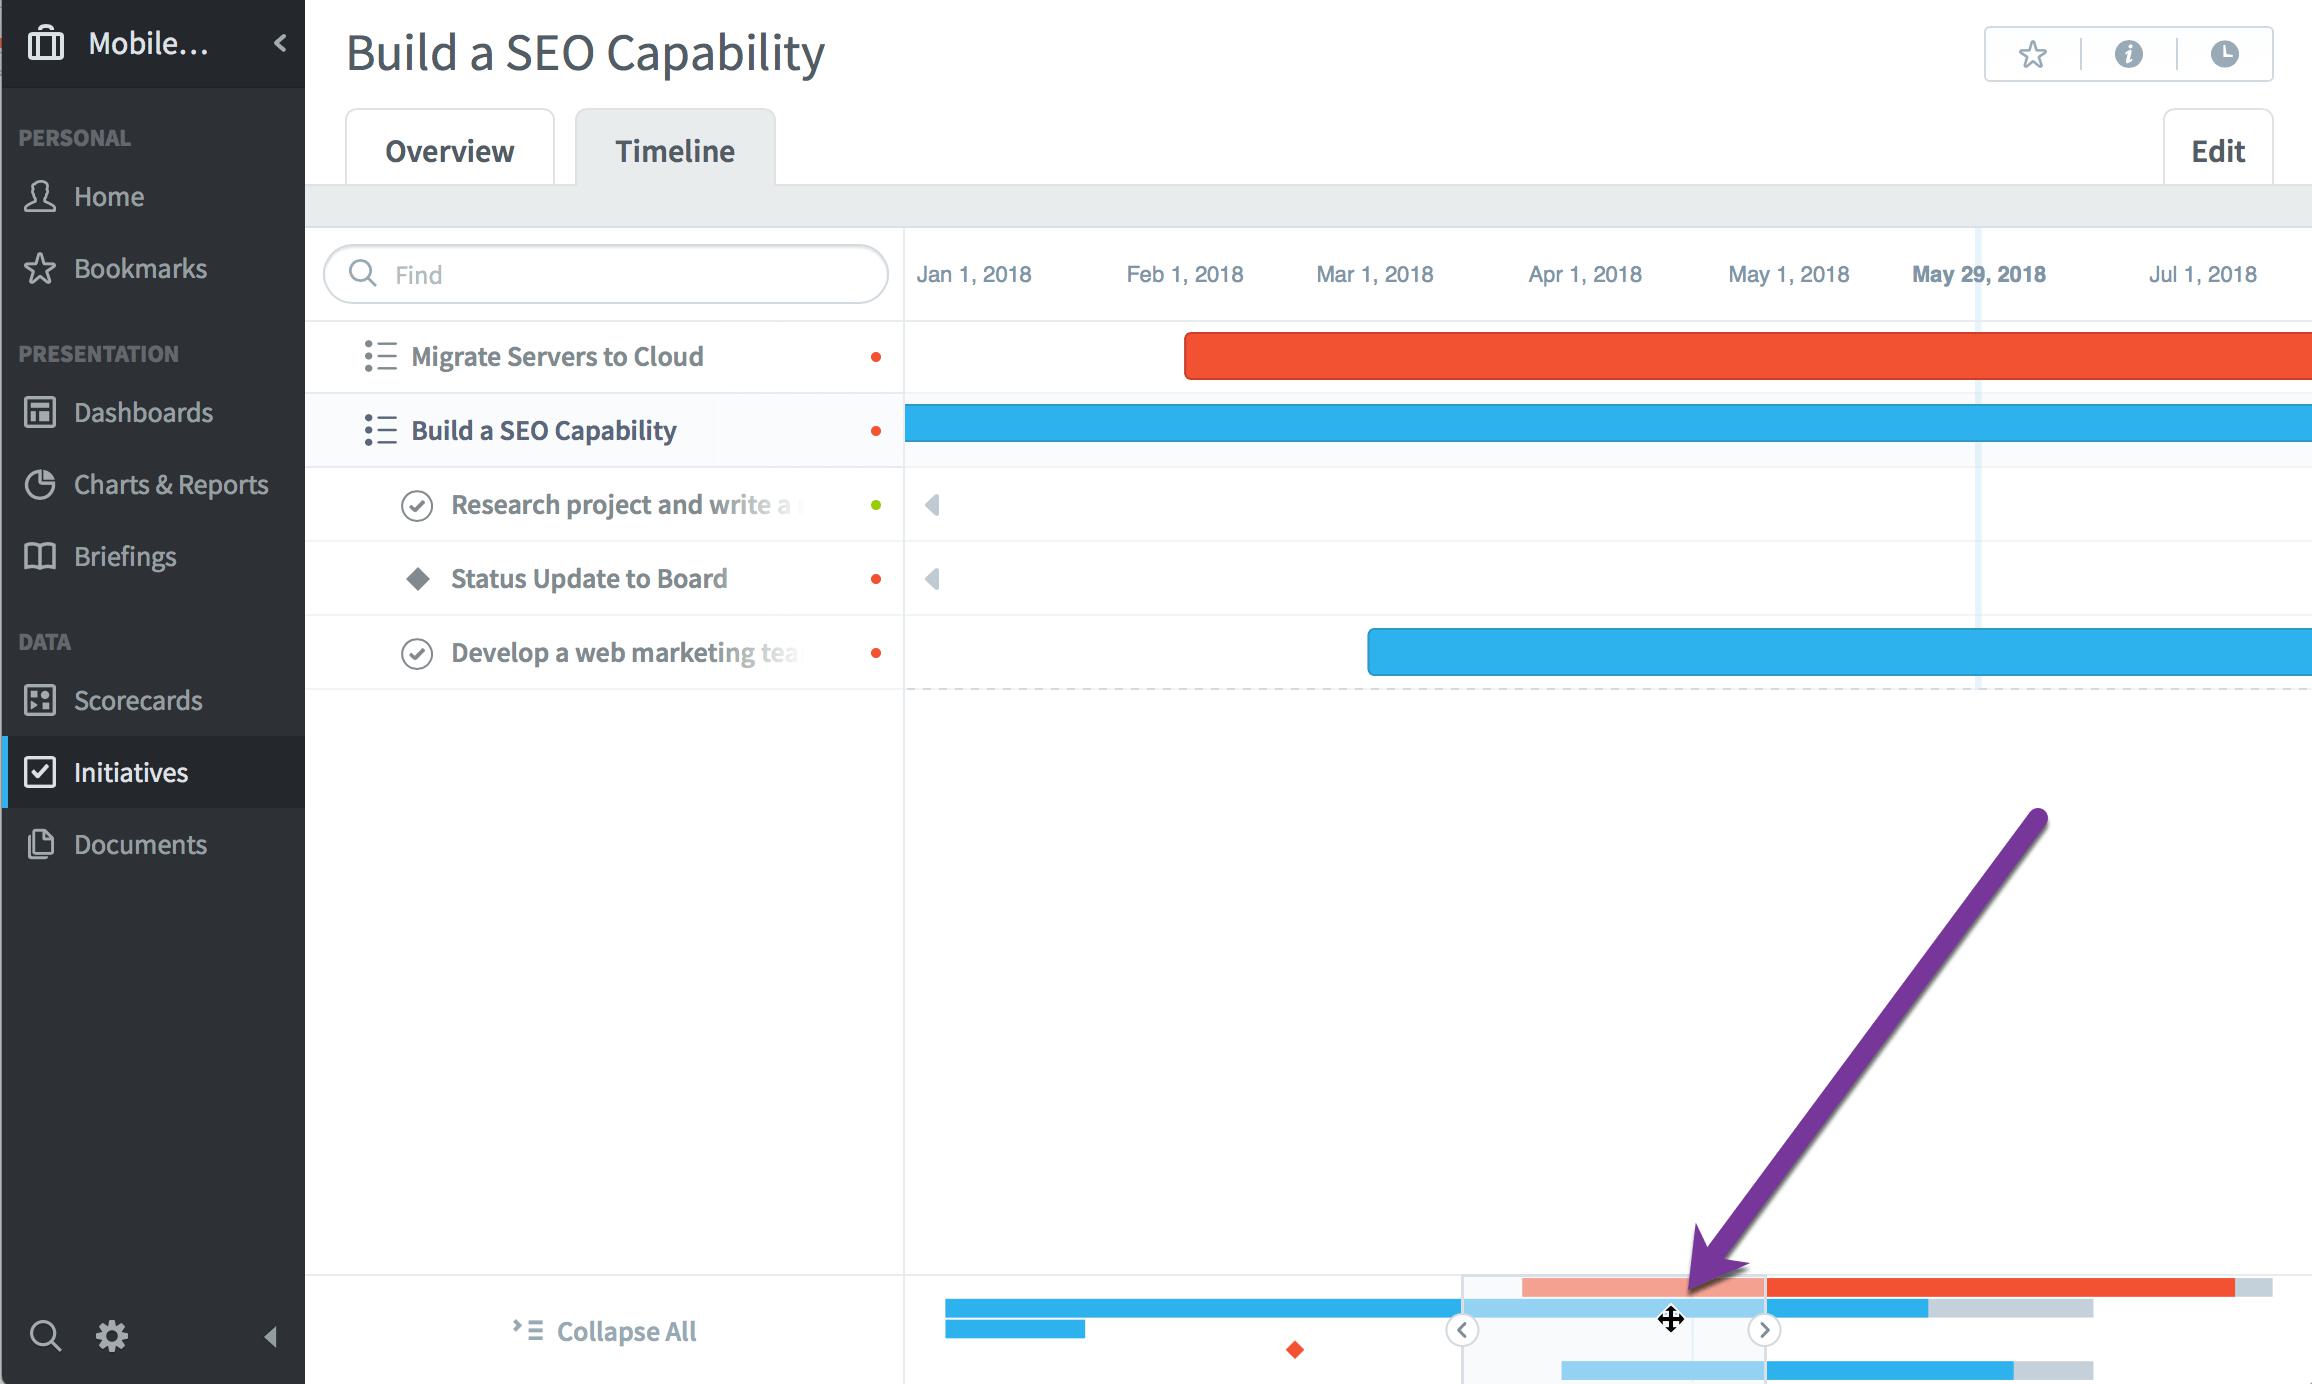
Just like everywhere else in QuickScore, you can expand and collapse the initiative tree on the left. There’s also a timeline navigation bar on the bottom that allows you to zoom and pan through time.
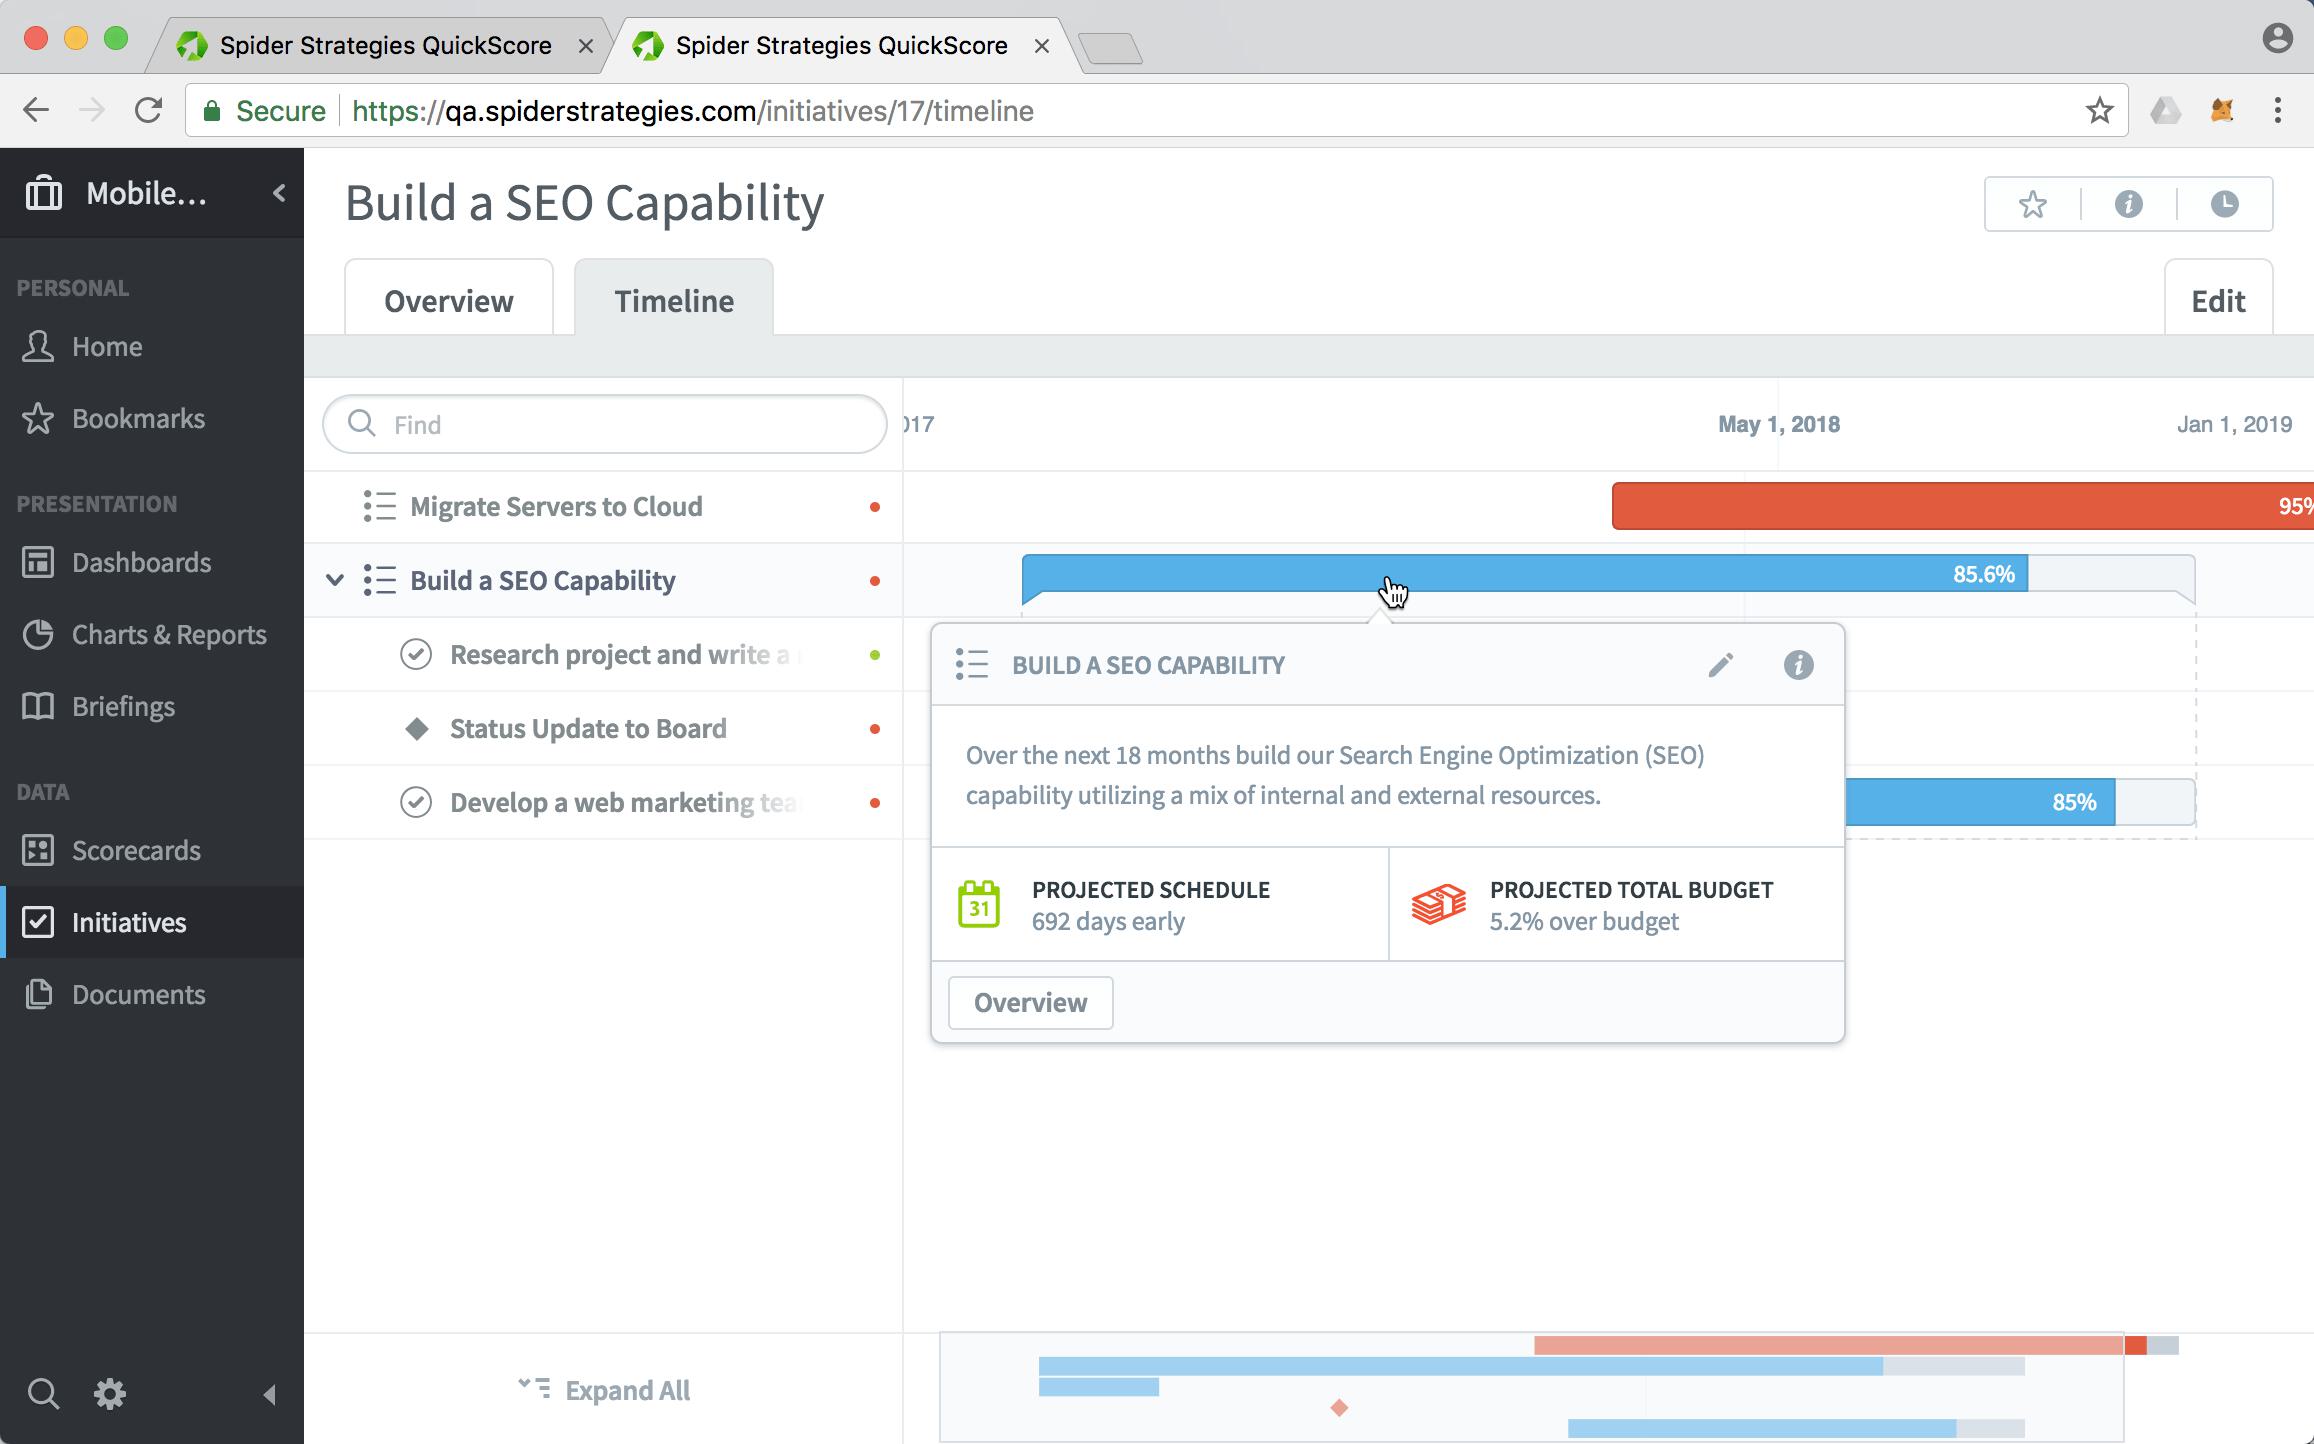
If you click on any of the initiative items in the Gantt chart, you can see detailed information about that item, like its description and the projected budget and schedule performance.


Experience Spider Impact for Free
Schedule a live demo or claim your free 30-day trial. We’re standing by to either show off Spider Impact or turn your data into a prototype for free.