More stunning dashboards from Scott
Dashboards
 Matt Sgarlata
December 3, 2009
Matt Sgarlata
December 3, 2009
Matt Sgarlata
December 3, 2009
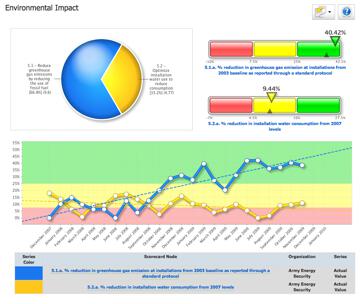
Check these out!
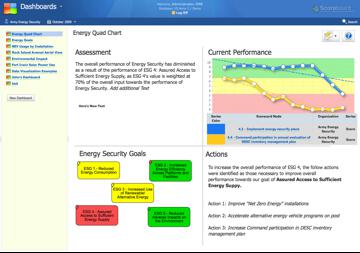
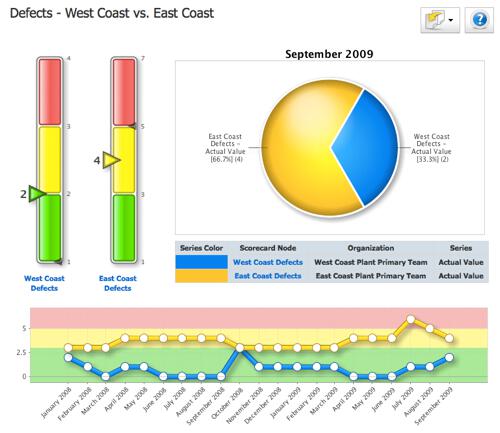
Here is an example of a quad chart, which is a popular chart in the US Army.
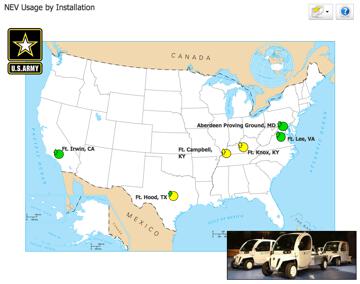
You can even upload maps to view real-time geographic performance data!
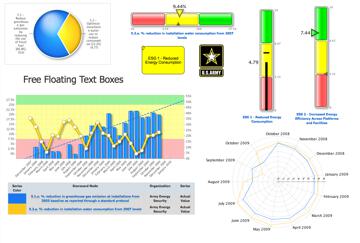
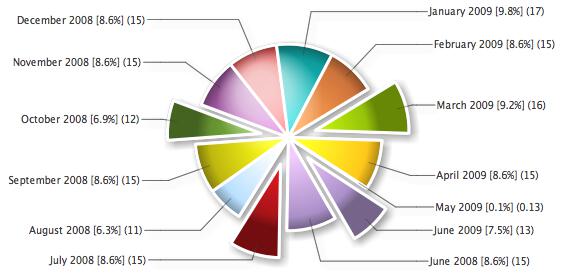
Here's an example with a Polar chart. You can really squeeze a ton of data into a presentation that is easy to understand at a glance!


Experience Spider Impact for Free
Schedule a live demo or claim your free 30-day trial. We’re standing by to either show off Spider Impact or turn your data into a prototype for free.