New Report Writer Flow in 3.2
 Scott O'Reilly
December 20, 2018
Scott O'Reilly
December 20, 2018
We’ve redesigned the report writer flow to be more intuitive and flexible. Instead of choosing filters first, we’ve focused on what you want your report to look like. Now the first step is choosing columns.
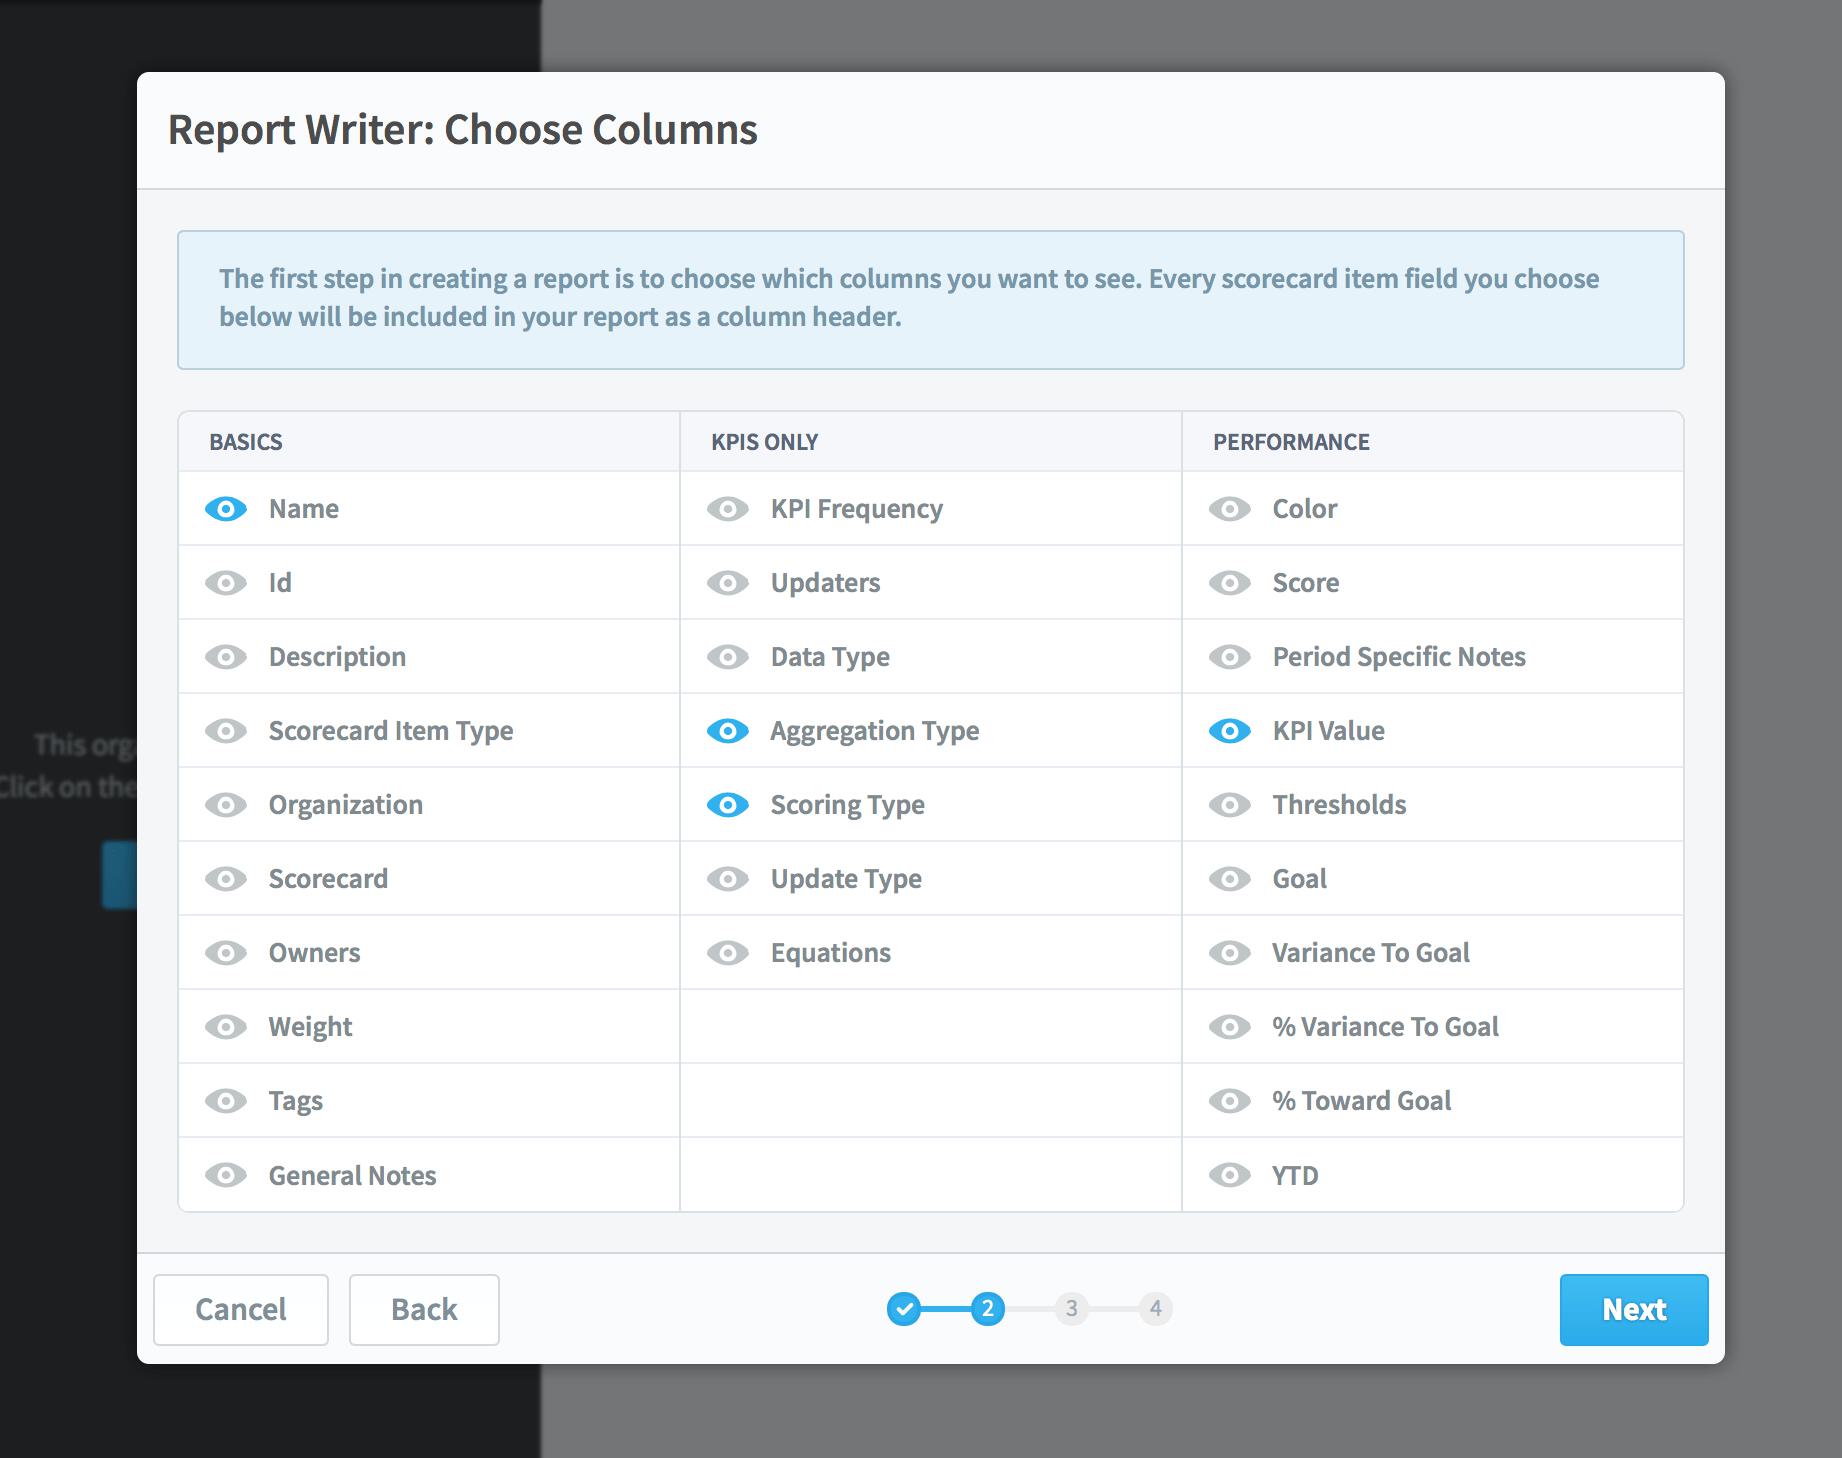
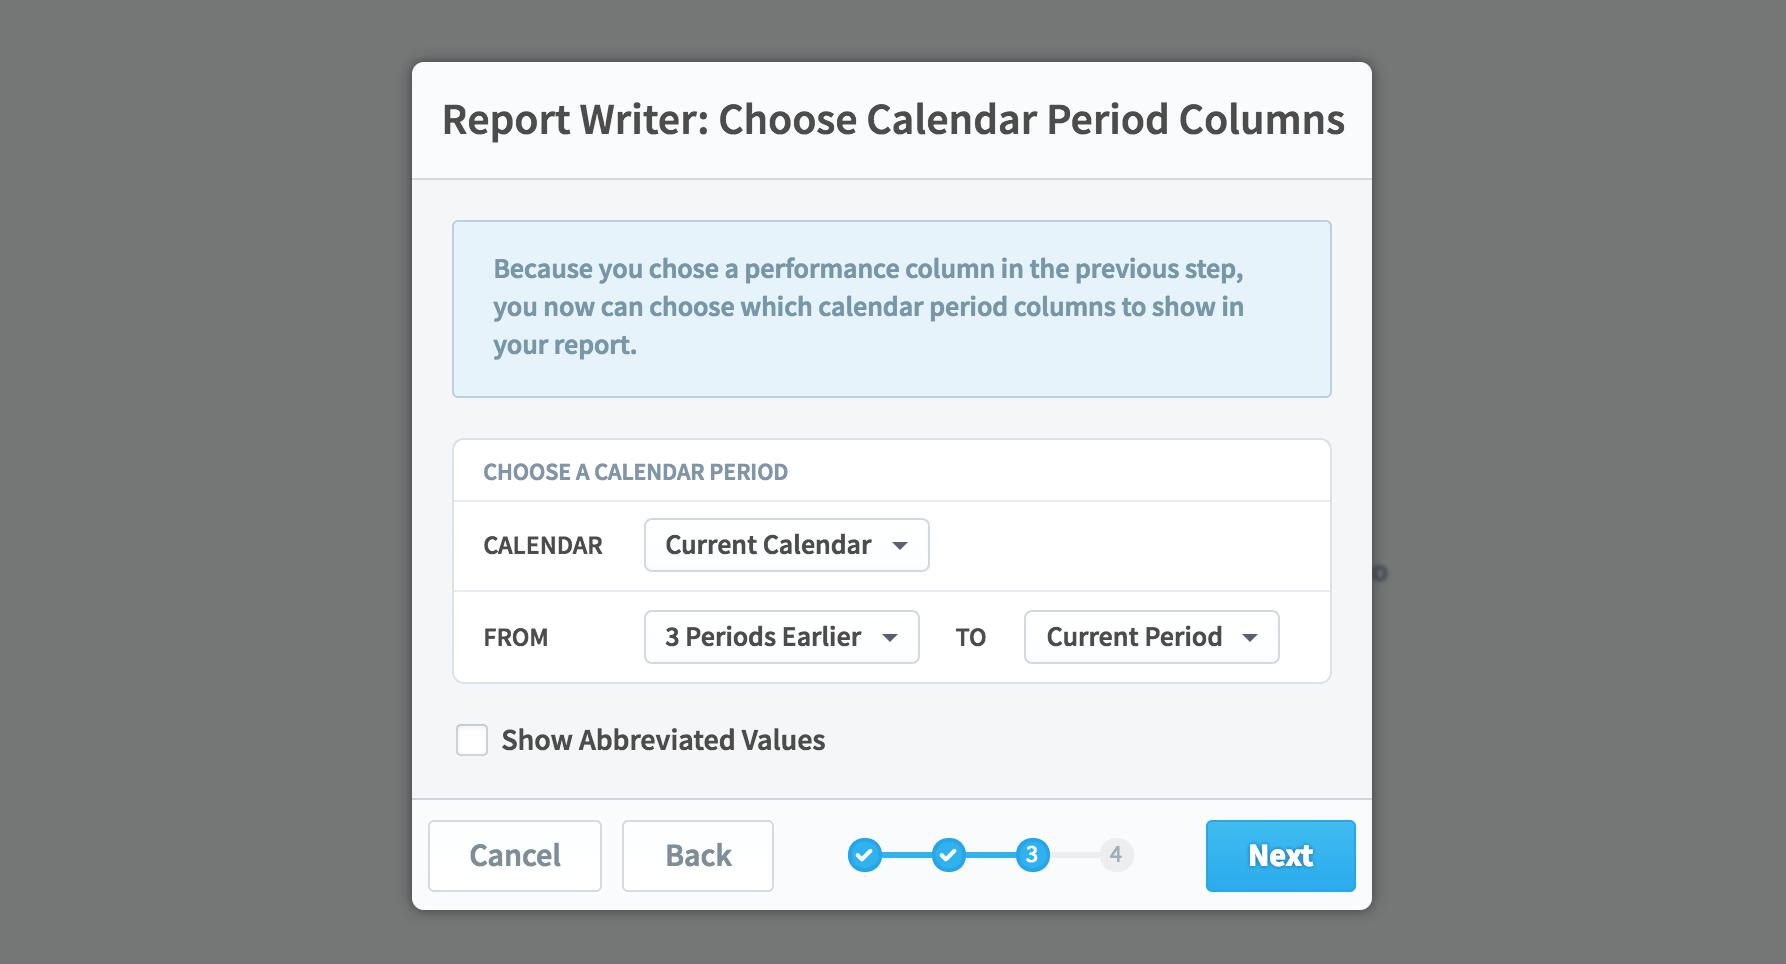
We’ve also reorganized this column selection step to group columns into basics, measures only, and performance. If you choose any performance columns, the next step is choosing which calendar periods you want to show for those performance values.
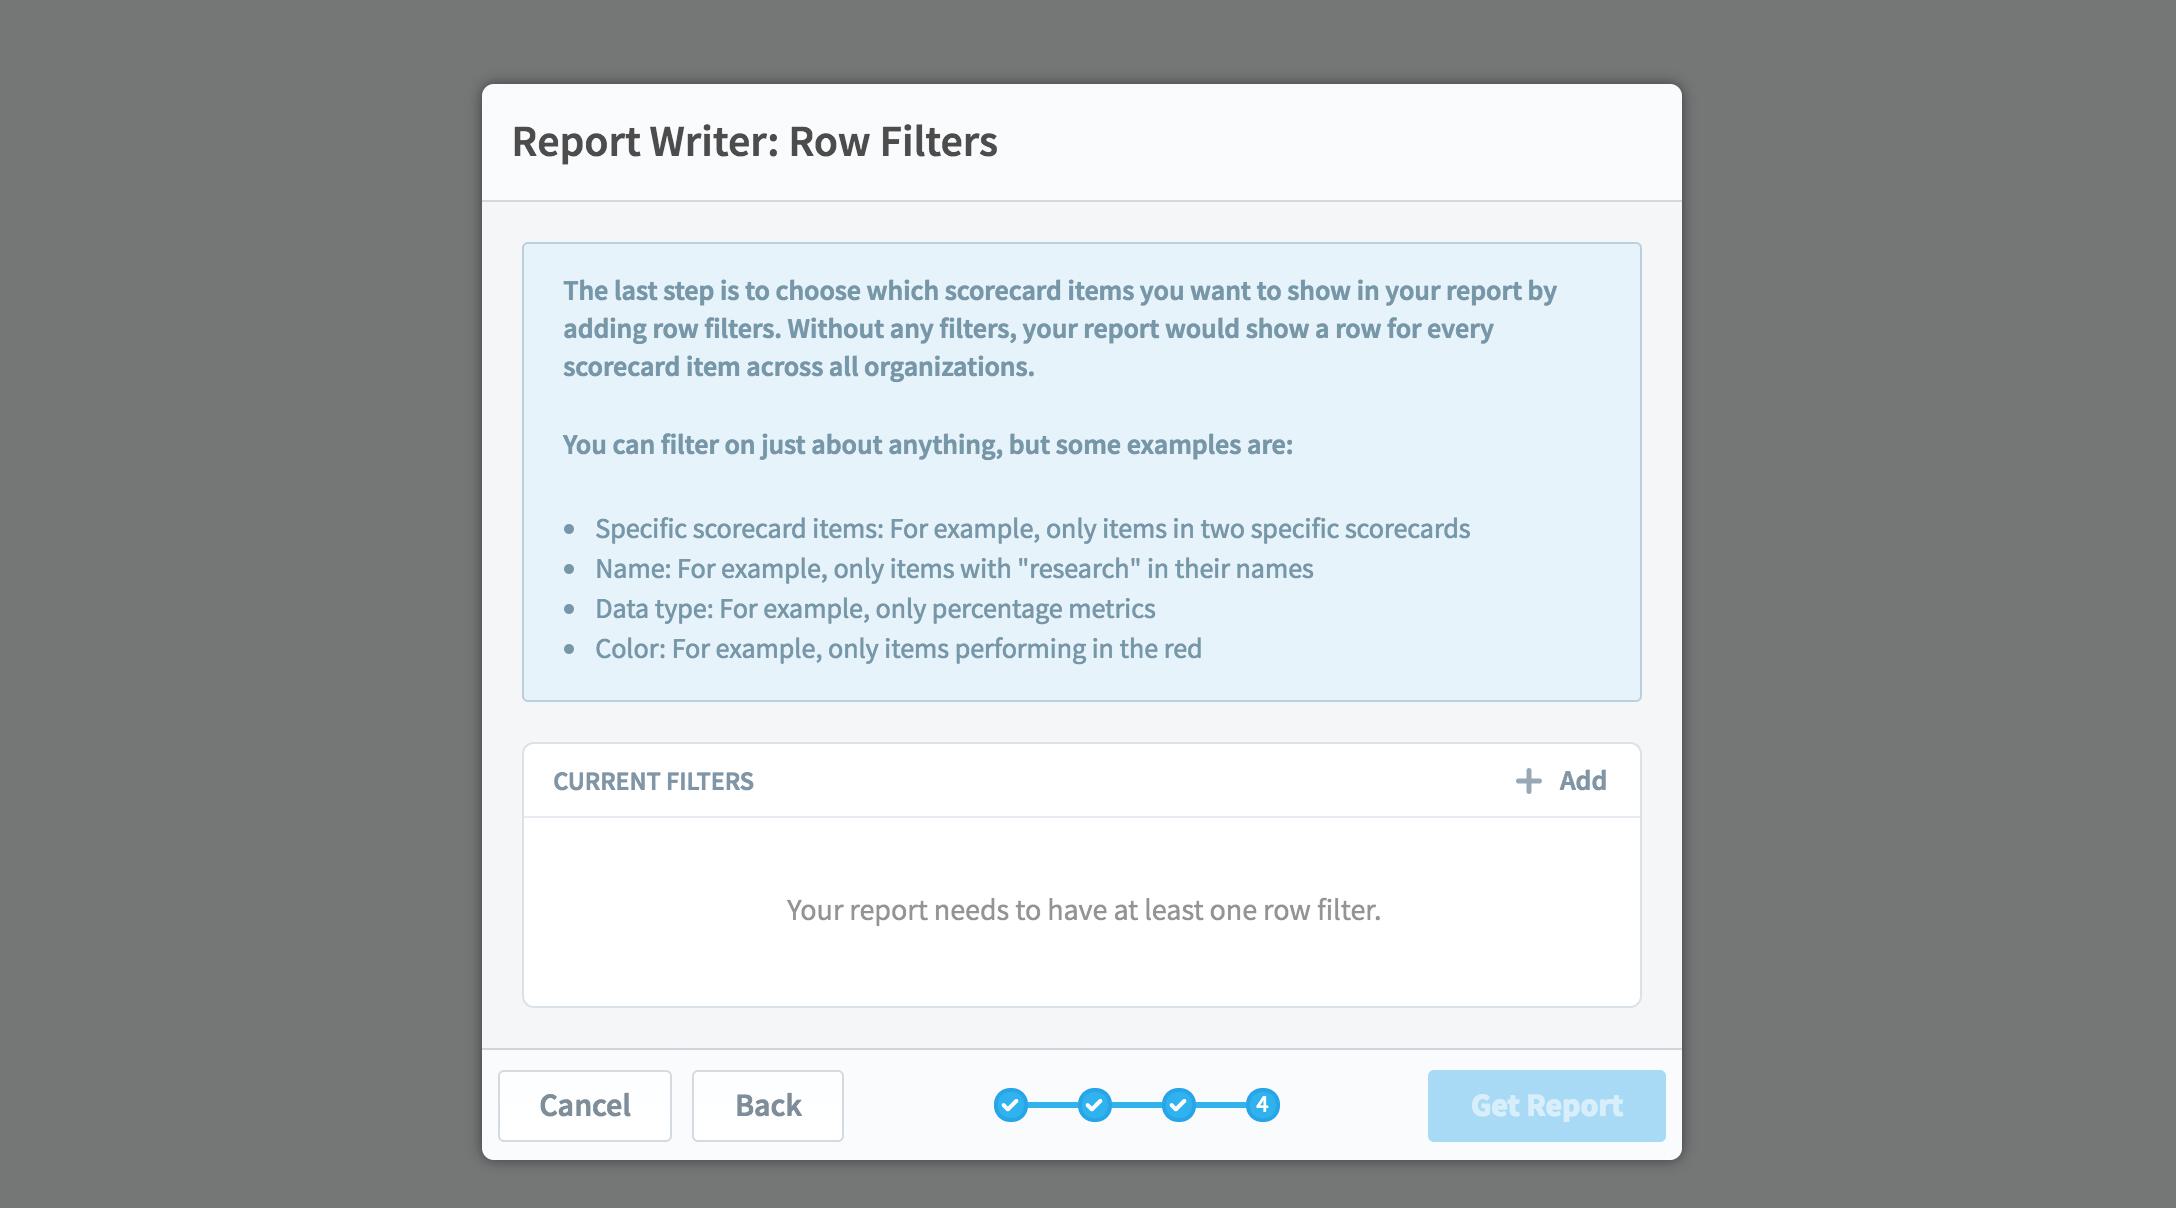
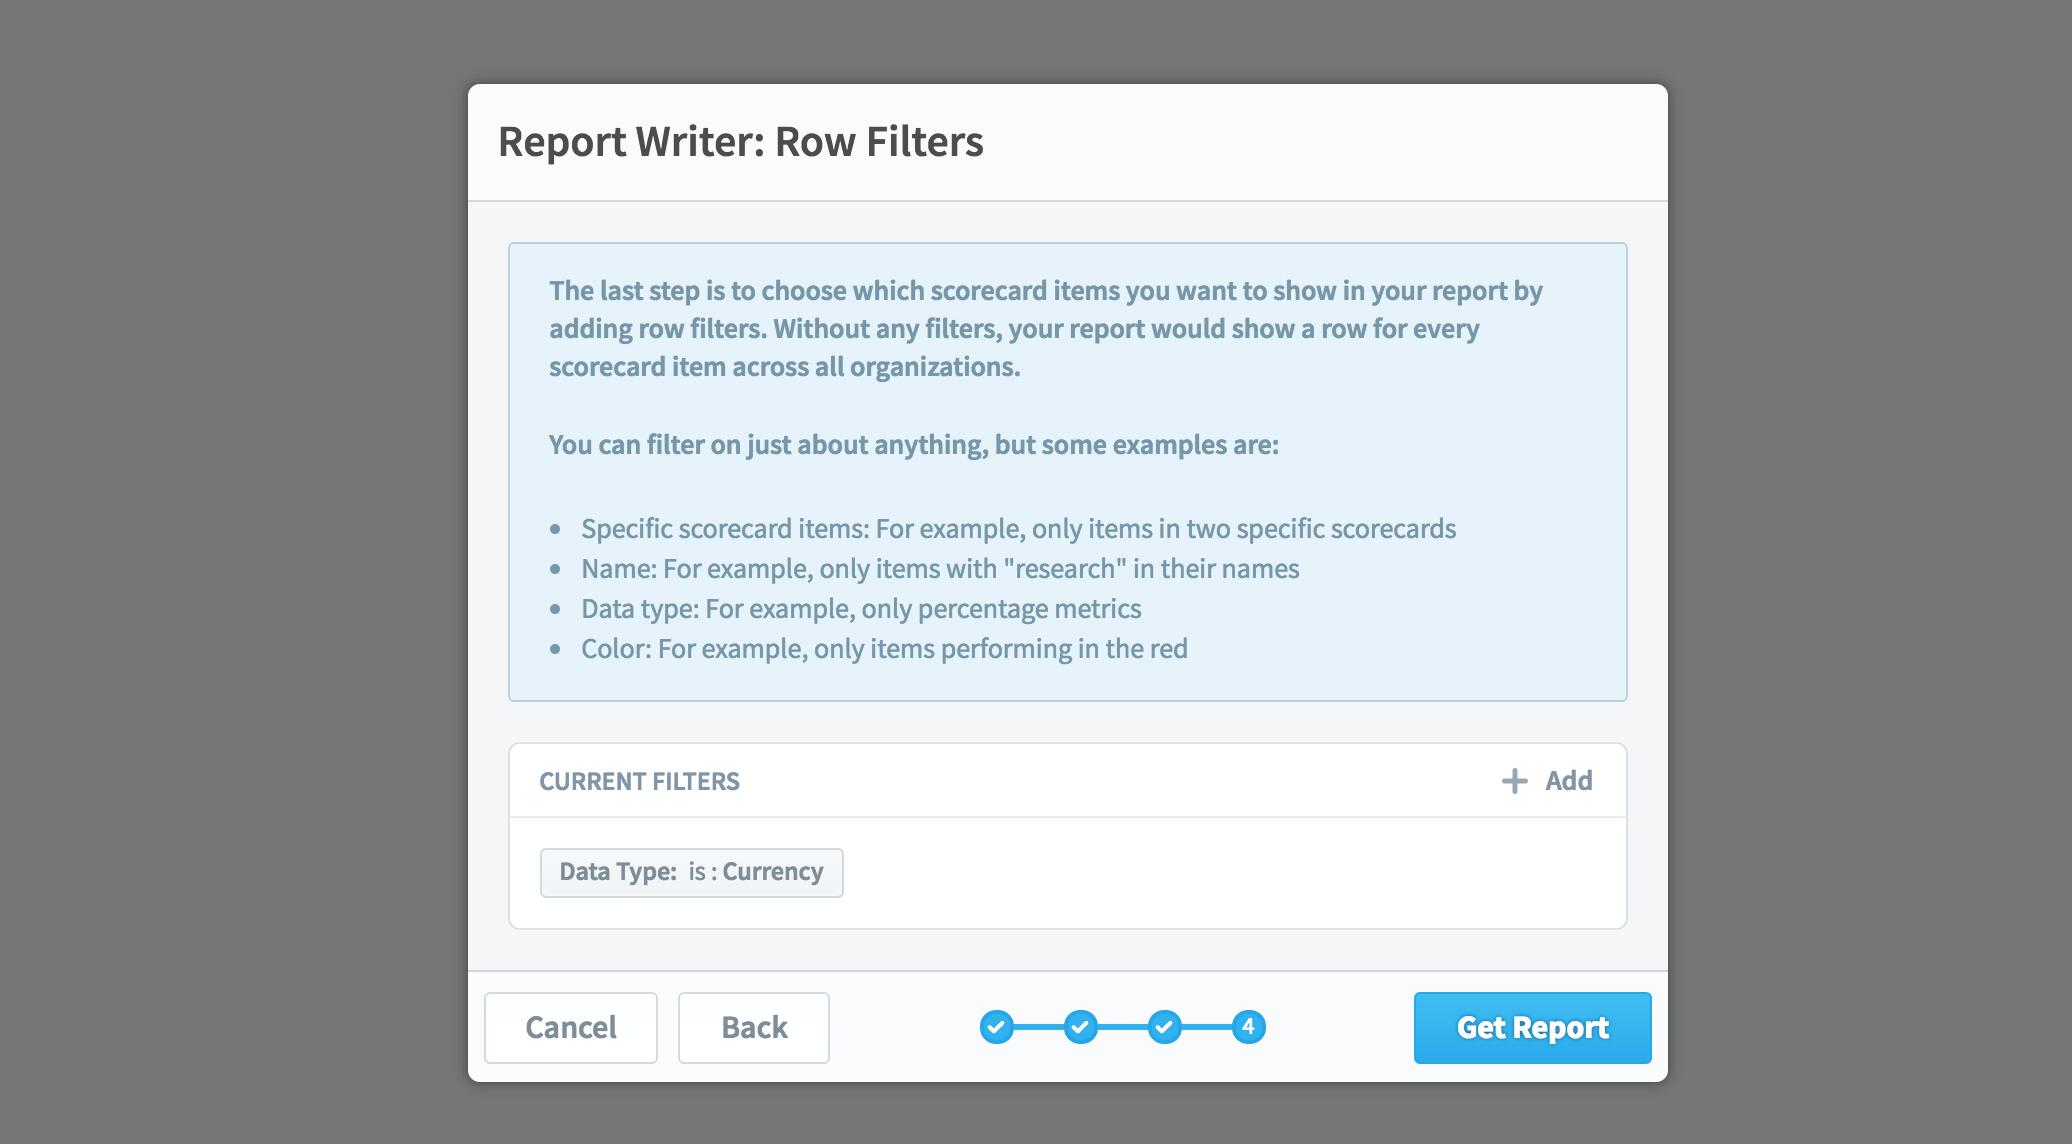
The final step is choosing filters. This is what it looks like when you haven’t added any filters yet.
When you click the “add” button, you can choose a filter to add. Here we’ve selected “data type” and then checked “currency.”
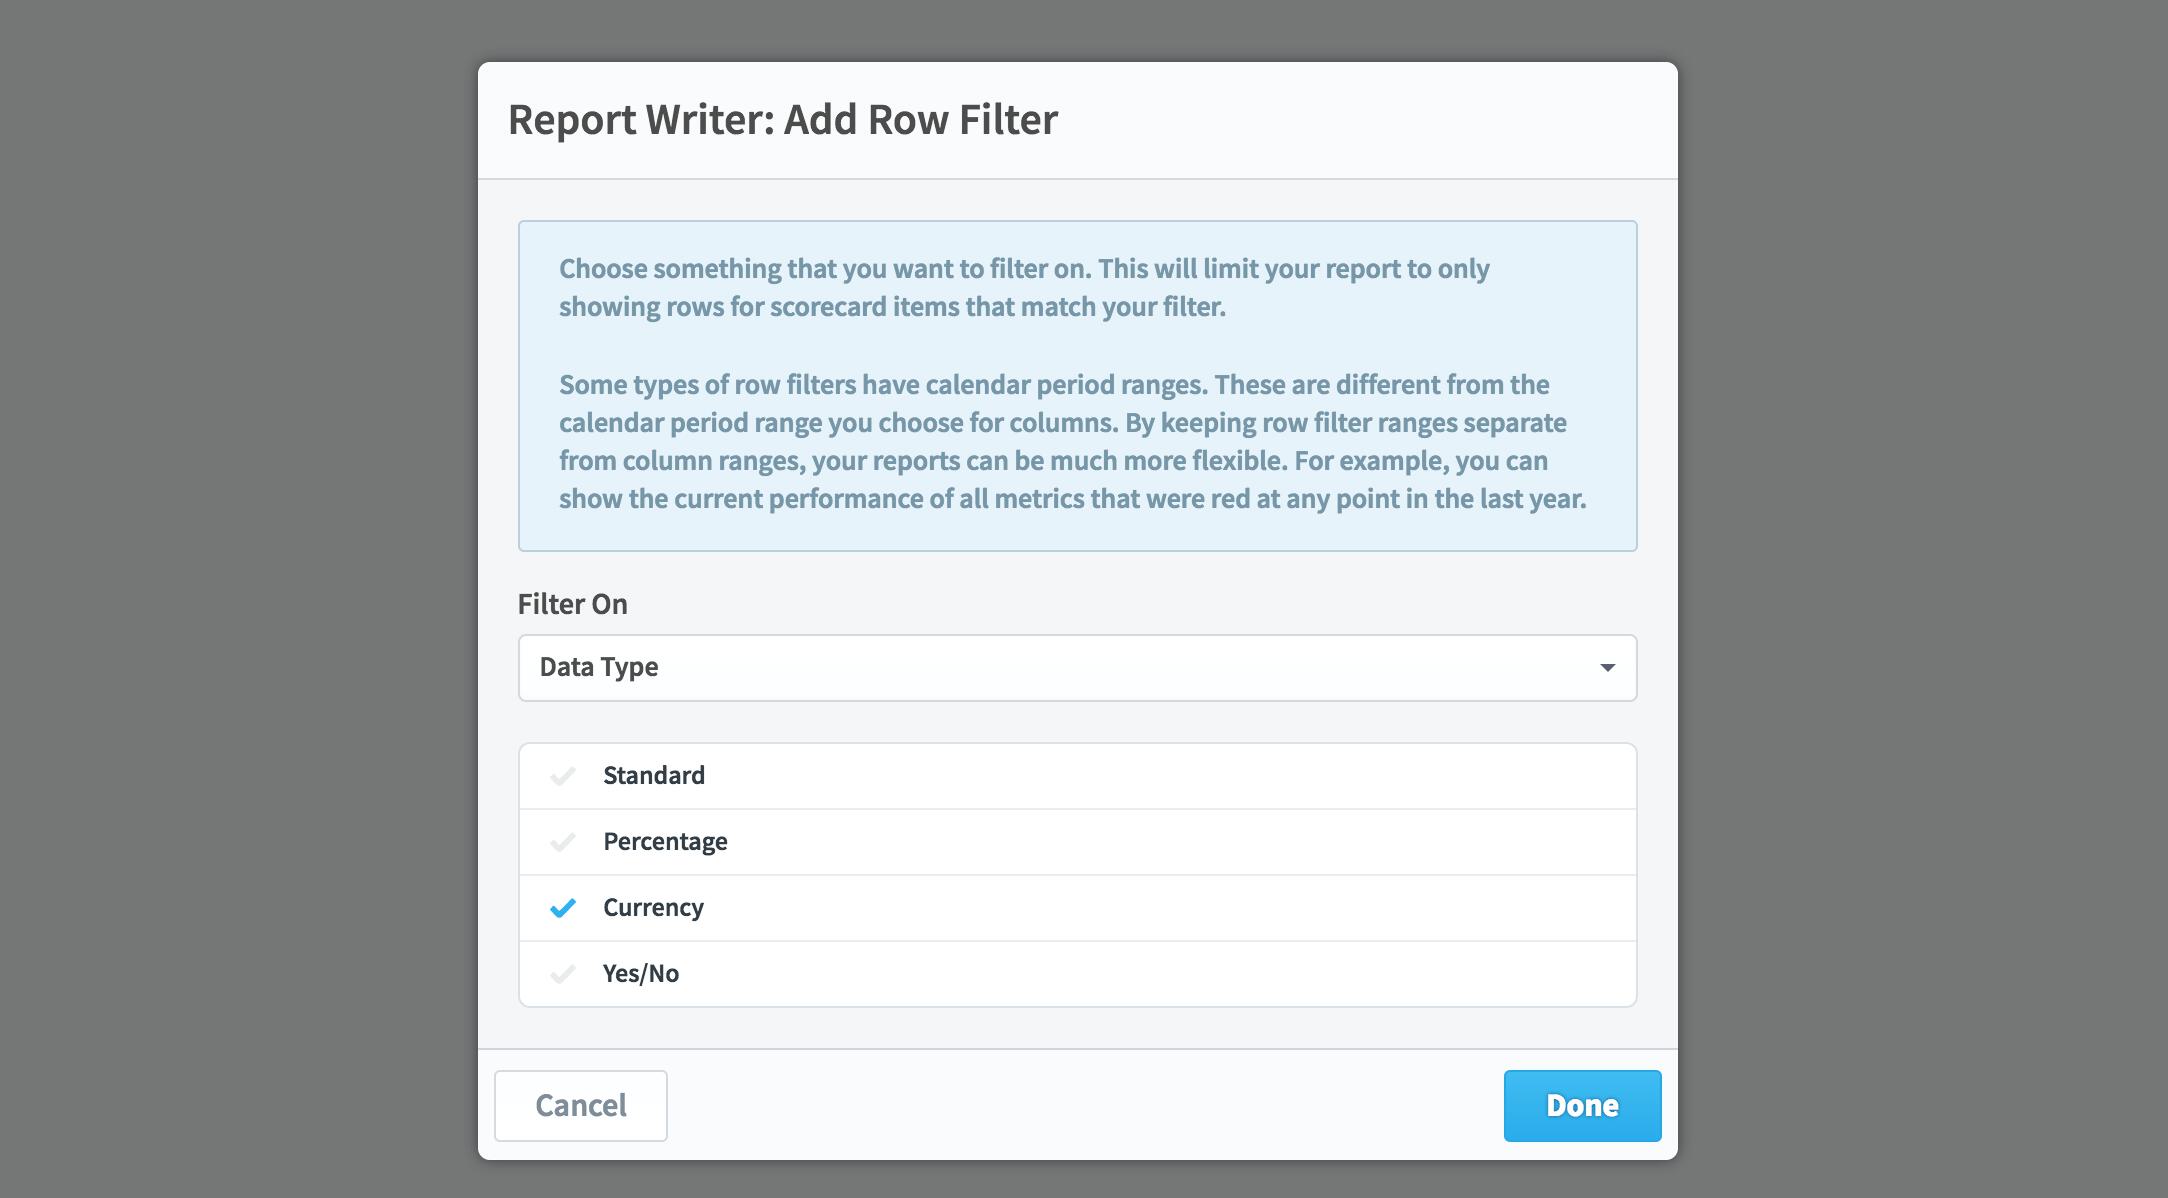
After clicking “done” we can see the filter we added, and we’re able to click the “get report” button.


Experience Spider Impact for Free
Schedule a live demo or claim your free 30-day trial. We’re standing by to either show off Spider Impact or turn your data into a prototype for free.