Separate Tree and Time Aggregations in 3.2
 Scott O'Reilly
November 29, 2018
Scott O'Reilly
November 29, 2018
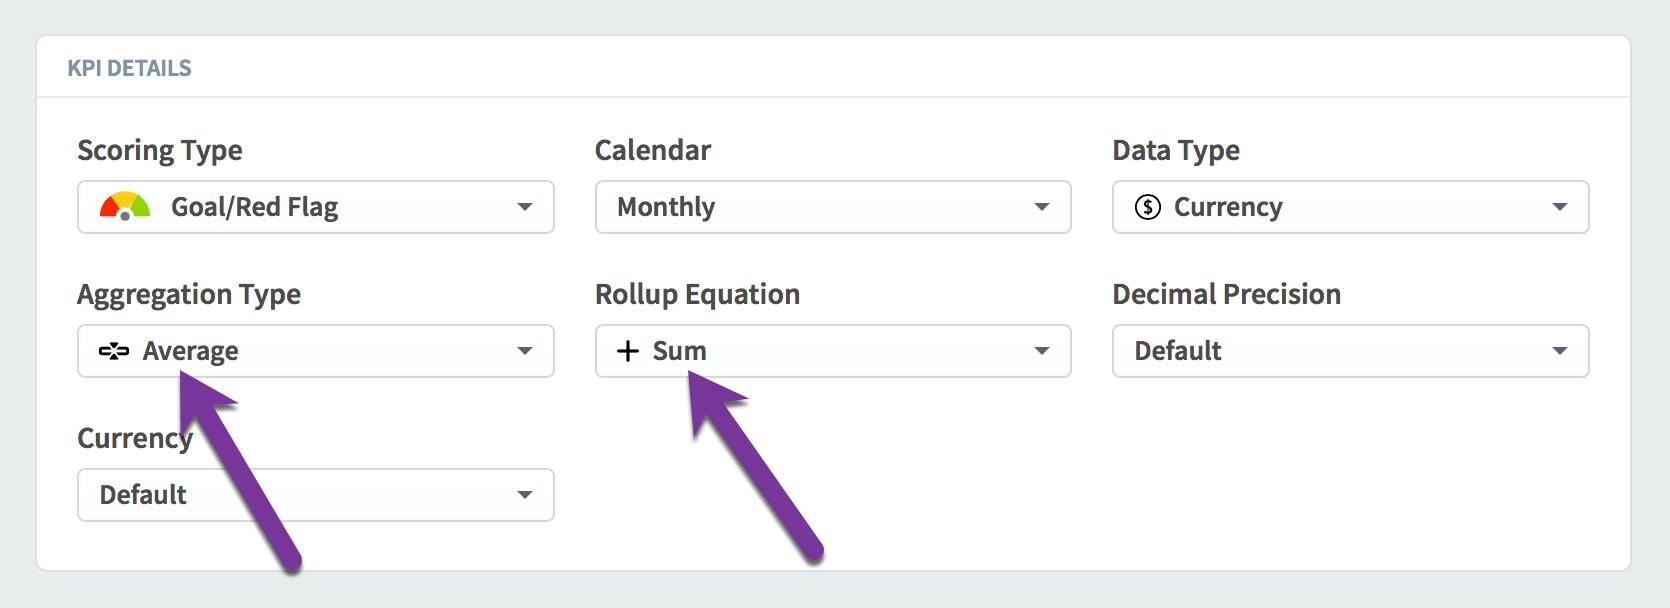
Rollup KPIs are aggregated in two different ways. The rollup equation is used when aggregating values up the organization tree. The aggregation type is used when aggregating smaller calendar periods into larger calendar periods, like turning monthly values into a yearly value.
An example will make it easier to understand the need for separate ways to aggregate. Let’s say we run a large waste disposal company and we’d like to reduce the number of trucks that are out of service due to them being repaired. We have dozens of trucks in each city, and thousands of trucks across each region, so we realize that there will always be some that are broken. We just want to minimize that number over time.
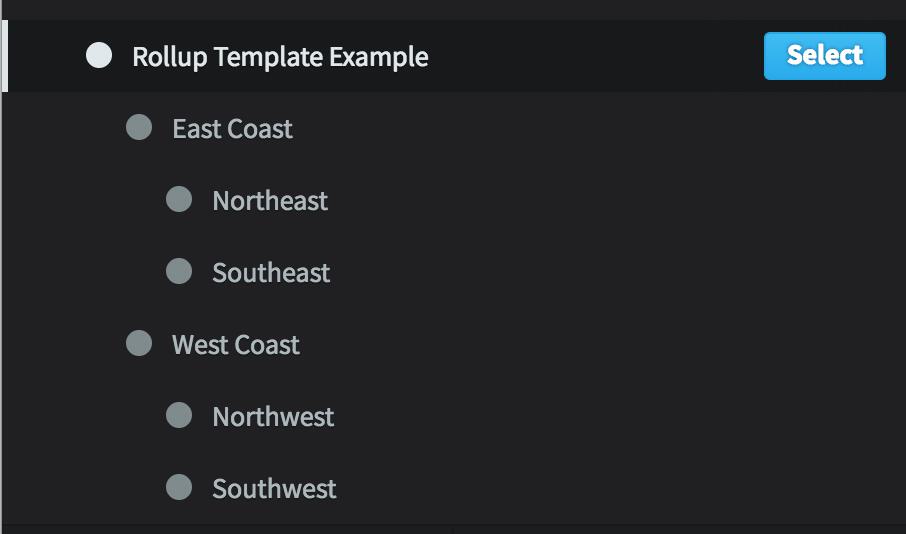
We’ll create a KPI called “Number of trucks out of service” that will track the number of broken trucks. We’ll also make it a rollup KPI and build out a multi-level templated organization structure that matches our company.
So, we have a rollup KPI that takes the number of broken trucks and aggregates them up the org tree. What should the rollup equation be? Sum makes the most sense, because the number of broken trucks at the regional level would be the sum of all broken trucks in that region’s cities.
Now, how do we aggregate our broken truck KPIs over time? That’s a little trickier. Let’s say each of the cities update their KPI with a new value every week. What should each city’s KPI value be when you look at it yearly? It doesn’t really make sense to add all of the weekly values together. That would mean that the more often you measure the KPI, the higher the yearly value will be.
For this KPI, an average aggregation type makes the most sense. If you measure the number of broken trucks every week, and average those numbers over a year, you can good a good feel for how many trucks are out of service most of the time.
With this KPI structure, you could go to a region in the organization tree, change the application calendar to monthly, and you could see the average number of broken trucks in that region for that month. Each city updates their broken truck KPI every week, and the software takes care of the rest.
And that’s why there are two different ways to aggregate rollup KPIs. There are situations like our example above where the KPI value should be summed up the rollup tree but averaged over time.


Experience Spider Impact for Free
Schedule a live demo or claim your free 30-day trial. We’re standing by to either show off Spider Impact or turn your data into a prototype for free.