Strategy Execution Blog
Explore strategy execution guides, BI tips, the latest innovations in analytics, and data literacy roadmaps, along with the latest software release info – your comprehensive resource for achieving peak performance.


VIP Content
The latest on strategy execution, KPIs, and business intelligence, straight to your inbox.


Strategic Health Assessment
Learn how your organization’s strategy execution and alignment stacks up against industry leaders, and identify opportunities for immediate improvement.
Take the Assessment


VIP Content
The latest on strategy execution, KPIs, and business intelligence, straight to your inbox.


Live Demo
Join us for a one-on-one interactive session to explore Spider Impact and answer your questions in real-time.
Book a Demo


VIP Content
The latest on strategy execution, KPIs, and business intelligence, straight to your inbox.


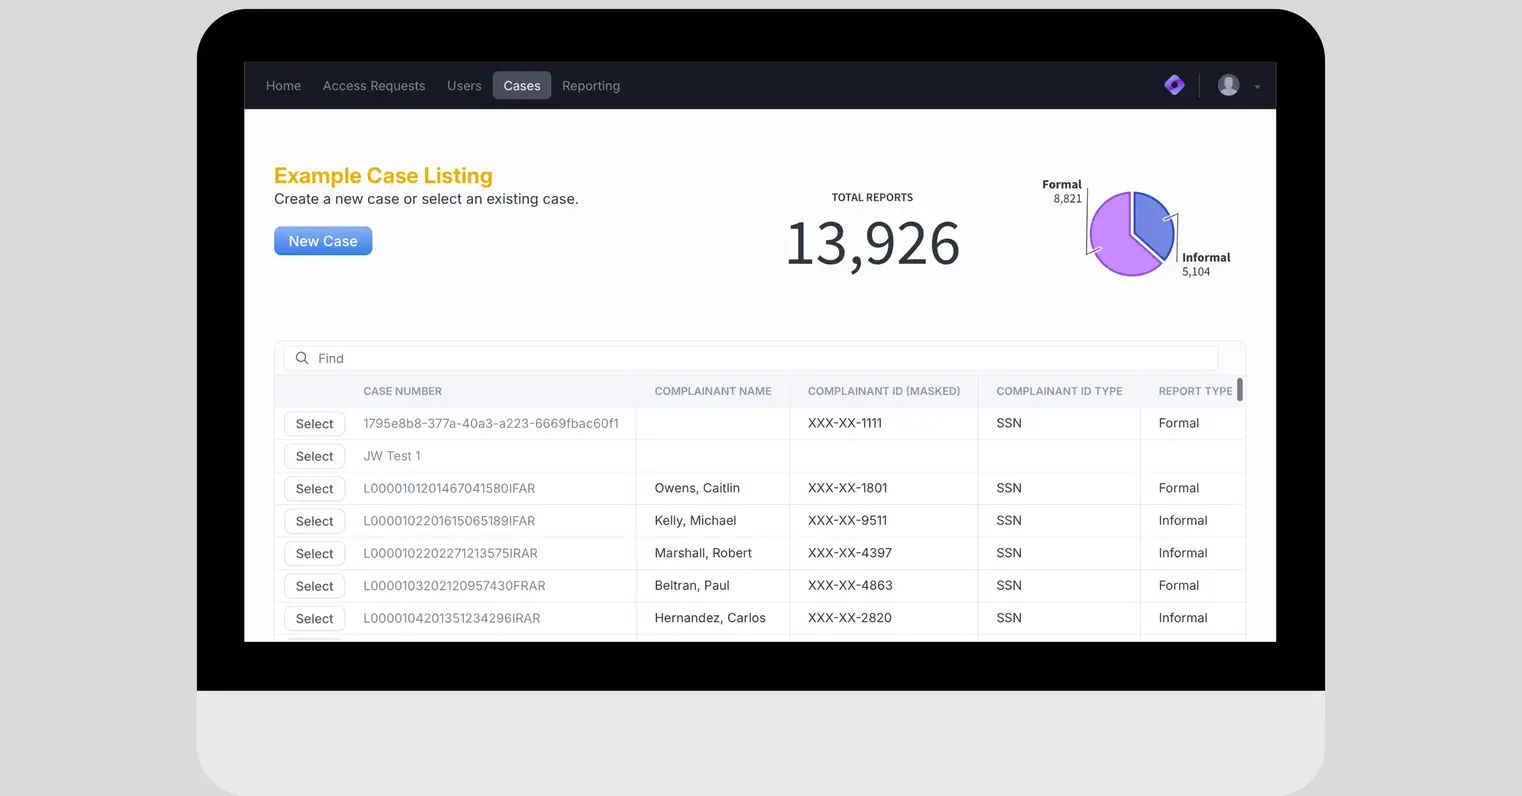
KPI Software
Manage KPIs with Spider Impact. Set goals, track progress, and unlock insights for peak performance.
Explore KPI Software


VIP Content
The latest on strategy execution, KPIs, and business intelligence, straight to your inbox.


Help from Experts
If your organization hasn’t fully defined its strategic plan, we've partnered with world-class experts to fast-track your strategy.
Get Expert Help


VIP Content
The latest on strategy execution, KPIs, and business intelligence, straight to your inbox.


Strategic Health Assessment
Learn how your organization’s strategy execution and alignment stacks up against industry leaders, and identify opportunities for immediate improvement.
Take the Assessment

VIP Content
The latest on strategy execution, KPIs, and business intelligence, straight to your inbox.


Live Demo
Join us for a one-on-one interactive session to explore Spider Impact and answer your questions in real-time.
Book a Demo
VIP Content
The latest on strategy execution, KPIs, and business intelligence, straight to your inbox.


KPI Software
Manage KPIs with Spider Impact. Set goals, track progress, and unlock insights for peak performance.
Explore KPI Software


VIP Content
The latest on strategy execution, KPIs, and business intelligence, straight to your inbox.


Help from Experts
If your organization hasn’t fully defined its strategic plan, we've partnered with world-class experts to fast-track your strategy.
Get Expert Help


VIP Content
The latest on strategy execution, KPIs, and business intelligence, straight to your inbox.


Strategic Health Assessment
Learn how your organization’s strategy execution and alignment stacks up against industry leaders, and identify opportunities for immediate improvement.
Take the Assessment


VIP Content
The latest on strategy execution, KPIs, and business intelligence, straight to your inbox.


Live Demo
Join us for a one-on-one interactive session to explore Spider Impact and answer your questions in real-time.
Book a Demo


VIP Content
The latest on strategy execution, KPIs, and business intelligence, straight to your inbox.


KPI Software
Manage KPIs with Spider Impact. Set goals, track progress, and unlock insights for peak performance.
Explore KPI Software


VIP Content
The latest on strategy execution, KPIs, and business intelligence, straight to your inbox.


Help from Experts
If your organization hasn’t fully defined its strategic plan, we've partnered with world-class experts to fast-track your strategy.
Get Expert Help

VIP Content
The latest on strategy execution, KPIs, and business intelligence, straight to your inbox.


Strategic Health Assessment
Learn how your organization’s strategy execution and alignment stacks up against industry leaders, and identify opportunities for immediate improvement.
Take the Assessment


VIP Content
The latest on strategy execution, KPIs, and business intelligence, straight to your inbox.
Live Demo
Join us for a one-on-one interactive session to explore Spider Impact and answer your questions in real-time.
Book a DemoVIP Content
The latest on strategy execution, KPIs, and business intelligence, straight to your inbox.
KPI Software
Manage KPIs with Spider Impact. Set goals, track progress, and unlock insights for peak performance.
Explore KPI SoftwareDemo then Free Trial
Schedule a personalized tour of Spider Impact, then start your free 30-day trial with your data.