See Spider Impact in Action
Take a tour of the software that gets everyone on the same page, working toward your strategic goals. Everyone has the information they need with beautiful dashboards, reports, and executive briefings.


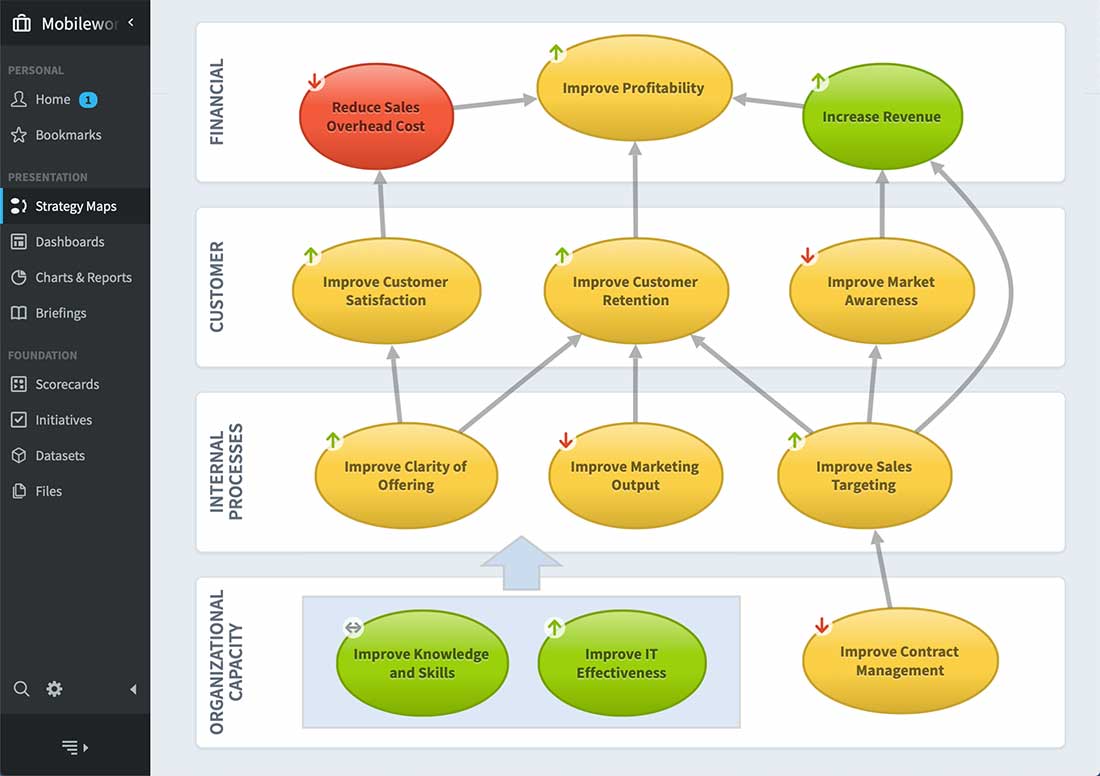
Strategy Execution
Get employees focused on driving performance
Things improve when everyone in your organization can see your big-picture strategy and how it relates to them. Empower each employee to continuously drive your performance.
Strategic Initiatives
Are your initiatives actually working?
Spider Impact predicts whether your initiatives will finish on time and under budget. More importantly, it tells you if they’re actually affecting your KPIs.
We built the entire platform around the notion that informed employees stage life-changing transformations for our clients, and that’s what drives growth.

AI & Automated Insights
Intelligence That Comes to You
Ask questions in plain language and get instant answers. Spider Impact predicts future performance, alerts you when metrics need attention, and suggests insights you didn't know to look for—so you discover opportunities and prevent problems before they become crises.
Meetings Reinvented
A better way to run a meeting
Spider Impact briefings focus your team on your latest data. Step through your slides, drill down to answer questions, then quickly resume where you left off. Meeting preparation is a snap, completely eliminating tedious slide-building work.
Want to see what Spider Impact can do for your team?
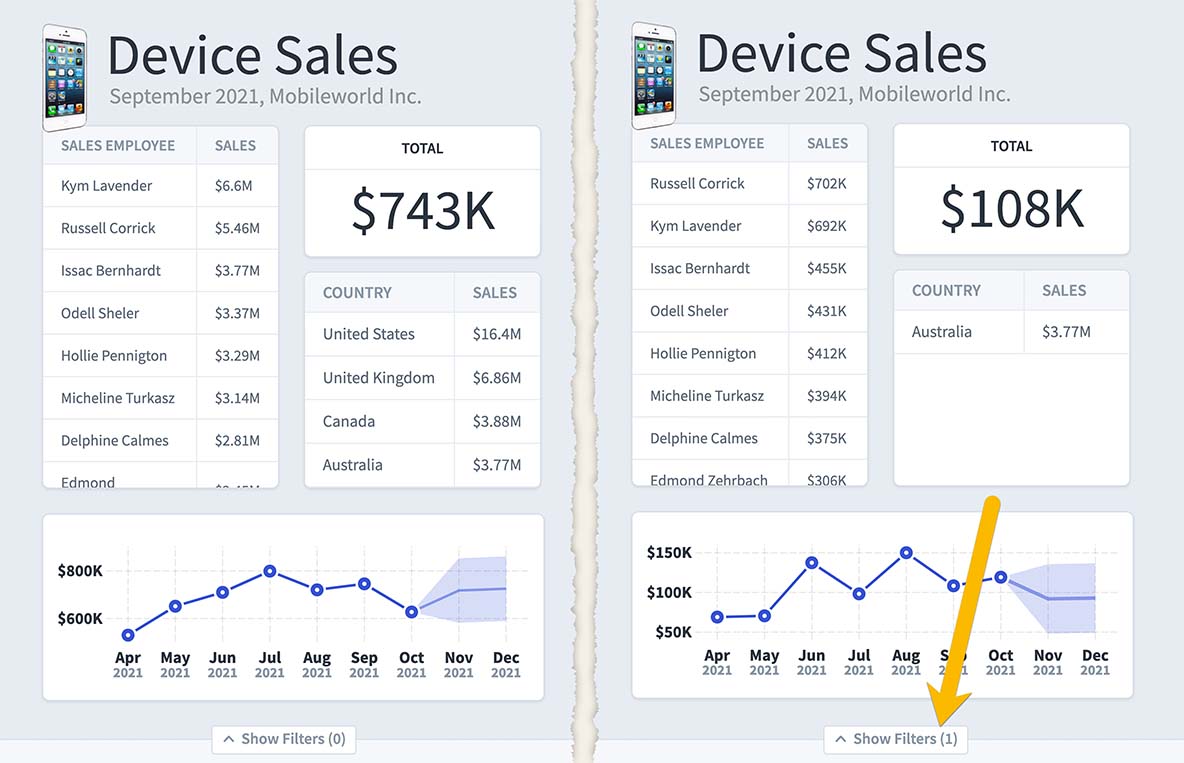
Business Intelligence
Strategy fueled by business intelligence
Once you’ve defined your strategic plan, stay on track with detailed analyses for better decision-making. Spider Impact datasets provide operational business intelligence to underpin your strategy.
Data Governance & Security
Personalized content & data access
Spider Impact delivers the right information to the right people at the right time with state-of-the-art data governance and security.
Features & benefits
With Spider Impact, you can create, implement, manage, and continuously improve your strategy and performance.
Deliver Immediate Value
Spider Impact can be up and running quickly and inexpensively for any organization. For organizations that have their scorecard and strategy ready to automate, you can easily enter or import your existing data. For organizations that are still working out strategic plans, Spider Impact can be used during the planning phase to help you quickly define your strategy and scorecard.
Data From Anywhere
Spider Impact allows you to collect data from across your organization and visualize it all in one place. You can pull data from spreadsheets, databases, thousands of SaaS tools via web service connections or Zapier, and even capture data directly with custom Forms.
Methodology Agnostic
Built to be methodology-agnostic, Spider Impact works with ANY performance management methodology, including Metrics & KPIs, Balanced Scorecard, Earned Value Management, and more.
Comprehensive Balanced Scorecard Solution
Spider Impact provides comprehensive balanced scorecard capabilities. If you use the Balanced Scorecard methodology, we're the best solution out there.
Services That Suit You
We’re committed to your success. In addition to free videos and webinars, we offer customized training and consulting services to maximize your return on investment in performance management. Our team of experts are here to meet your unique needs in every phase of your implementation and growth. Whatever your requirements, we’ve got you covered.
Anytime, Anywhere Accessibility
Spider Impact can be accessed for better decision-making anytime, anywhere. We support all digital devices, so you can access your performance metrics whether you’re using your laptop or your mobile devices.
Flexible Deployment Options
Spider Impact is available in the cloud so you can completely take the burden off of your technical resources. Or, you can host the application in your own data center. Now there are no obstacles in the way of driving better organizational performance.
Safe & Secure in the Cloud
If you decide to use our software in the cloud, you can rest easy knowing your data is safe. We have processes and safeguards in place designed to protect the assets and data you entrust us with. We cover all of the details in our Data Center Security and Support Guide.
Spider Impact Advantages
Spider Impact bridges the gap between strategy and execution. It highlights the operational data you need to run your organization, while never losing sight of your big-picture goals.
Demo then Free Trial
Schedule a personalized tour of Spider Impact, then start your free 30-day trial with your data.