Reports Now on Dashboards
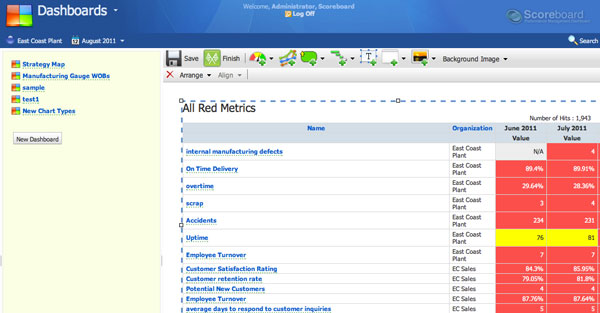
Version 2.3 now offers the ability to add reports and charts from the Reports section to dashboards. This can be very helpful to see things like all of your red metrics, or just the metrics that are trending downward.

Experience Spider Impact for Free
Schedule a live demo or claim your free 30-day trial. We’re standing by to either show off Spider Impact or turn your data into a prototype for free.


