


FAQs
What Is KPI Software?
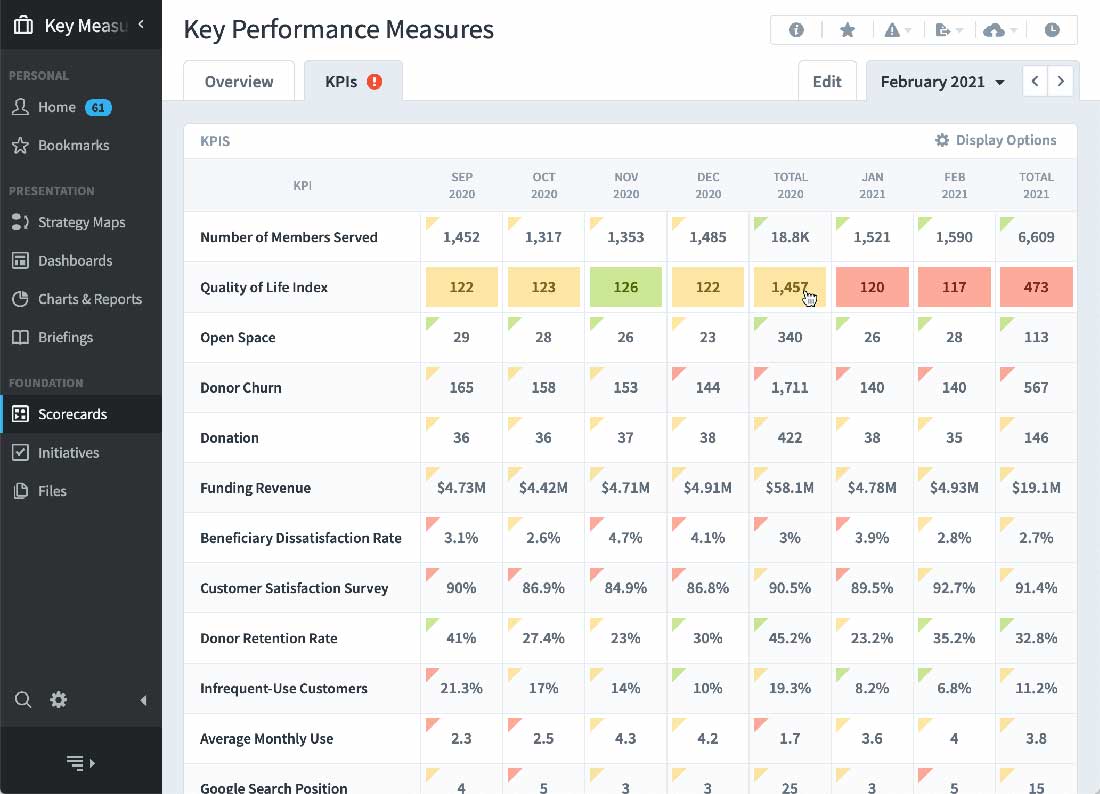
KPI software is a specialized tool designed to help businesses track, manage, and analyze their key performance indicators (KPIs). These metrics are crucial for understanding how well an organization is performing in various areas. Spider Impact's KPI software allows users to set specific goals, monitor progress, and visualize data through dashboards and reports. By providing a clear and organized view of performance metrics, it helps businesses make data-driven decisions, identify trends, and address issues proactively. This type of software is essential for maintaining a strategic overview and guiding an organization toward its objectives.
How Does KPI Software Improve Business Performance?
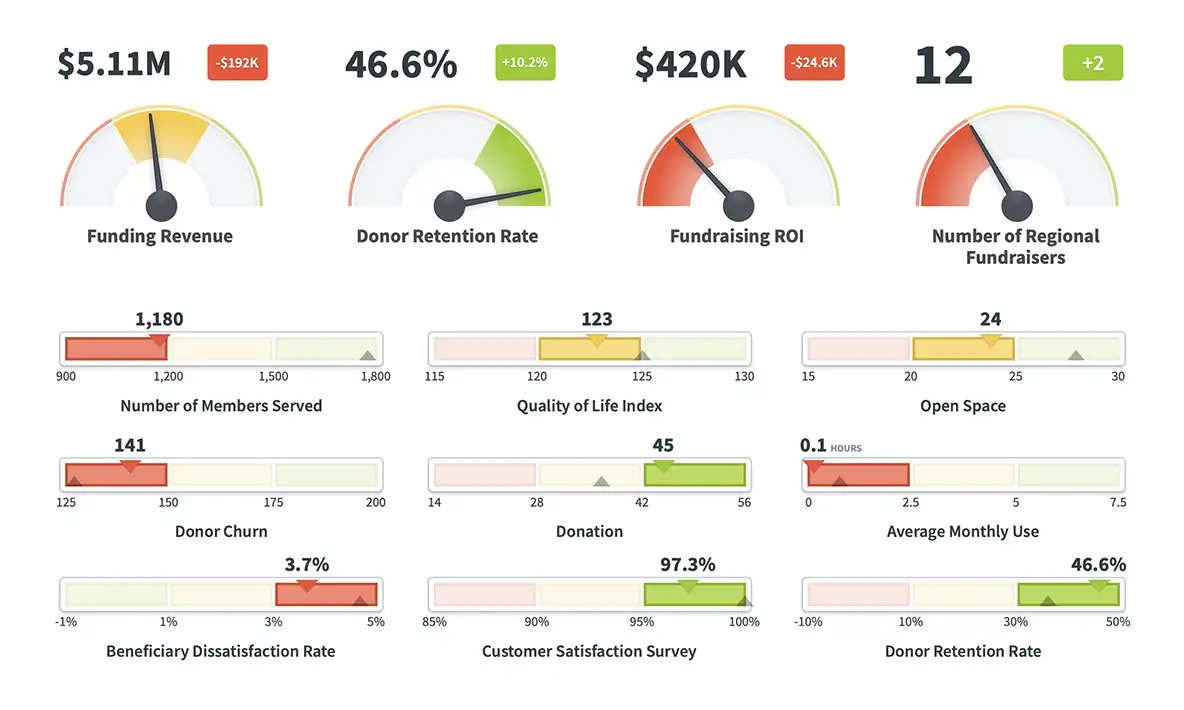
KPI software like Spider Impact significantly enhances business performance by offering a structured approach to managing and analyzing key metrics. It enables organizations to set clear, measurable goals and track their progress over time. By providing real-time insights into performance, it helps identify areas of strength and weakness. This visibility allows managers to allocate resources more effectively and implement targeted strategies to improve outcomes. Also, the ability to visualize data through intuitive dashboards and reports helps teams understand their impact and stay motivated to achieve their targets.
How Does KPI Software Support Goal Alignment?
Spider Impact's KPI software plays a crucial role in aligning goals across an organization. By centralizing the tracking of key performance indicators, it ensures that everyone is working towards the same objectives. The software helps set and monitor KPIs at various levels, from individual employees to entire departments. This alignment creates a unified approach to achieving business goals. Regular updates and visual reports keep all team members informed and on track, promoting a cohesive effort towards common targets. This clarity and coordination are essential for driving organizational success.
How Does KPI Software Help Eliminate Waste and Reduce Burden?
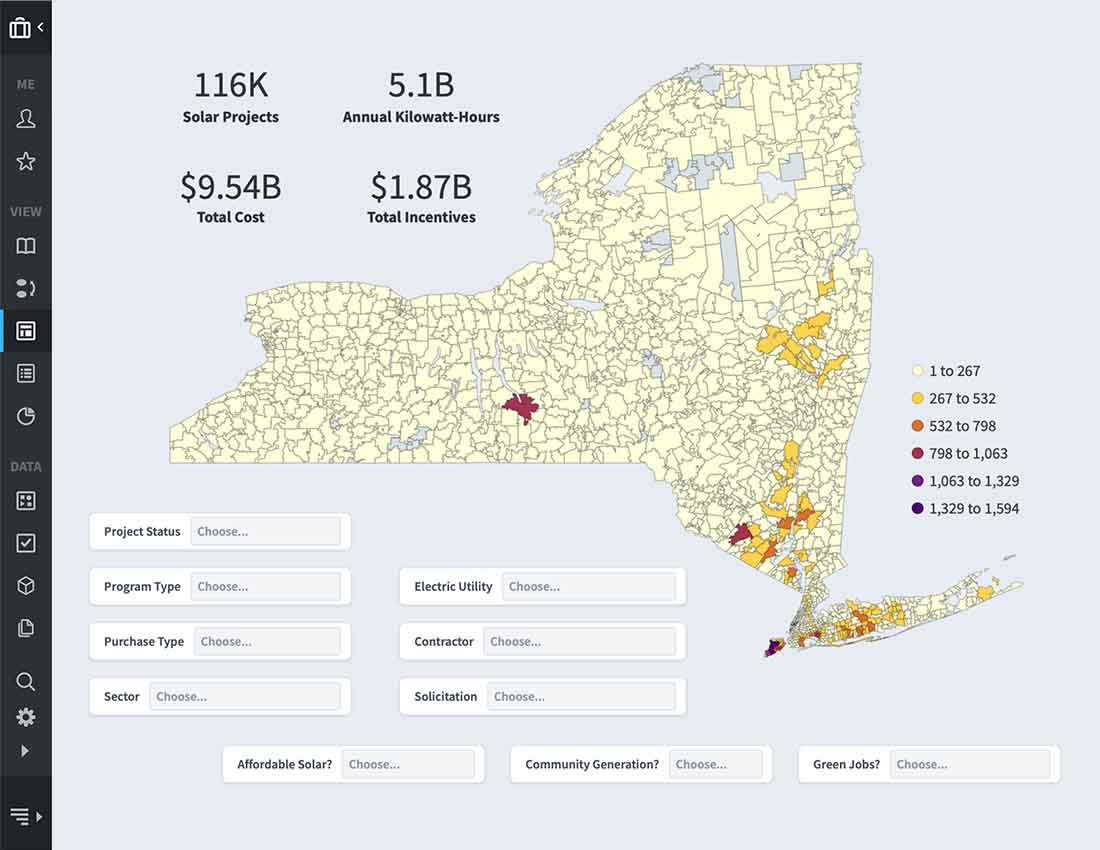
KPI software like Spider Impact aids in identifying and eliminating waste by providing clear insights into operational performance. By tracking key metrics, businesses can pinpoint inefficiencies and areas where resources are being misused. This visibility helps reallocate resources to more productive activities, thus reducing the overwhelming burden. The software’s analytical capabilities allow for continuous monitoring and assessment, so organizations can implement process improvements and optimize their operations. This targeted approach not only enhances productivity but also contributes to a leaner, more agile organization capable of adapting to changing demands.
What Is a HuddleBoard in KPI Software?
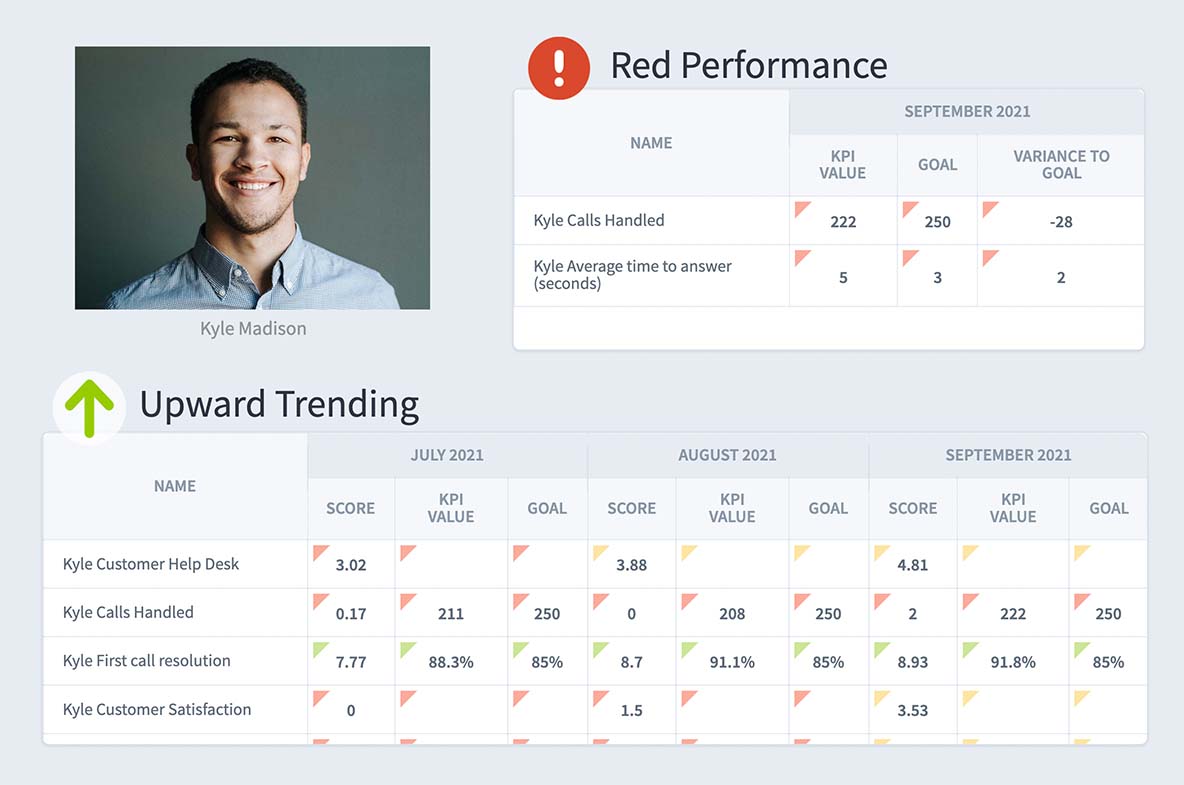
A HuddleBoard in KPI software, such as the one offered by Spider Impact, is a dynamic visual tool used to facilitate team meetings and discussions. It provides a real-time snapshot of key performance indicators, allowing teams to review progress, discuss challenges, and plan actions collaboratively. The HuddleBoard displays data in an easily digestible format. This feature promotes transparency and accountability within the team, encouraging regular communication and a shared focus on achieving goals. By keeping everyone informed and engaged, the HuddleBoard helps drive collective performance improvements.