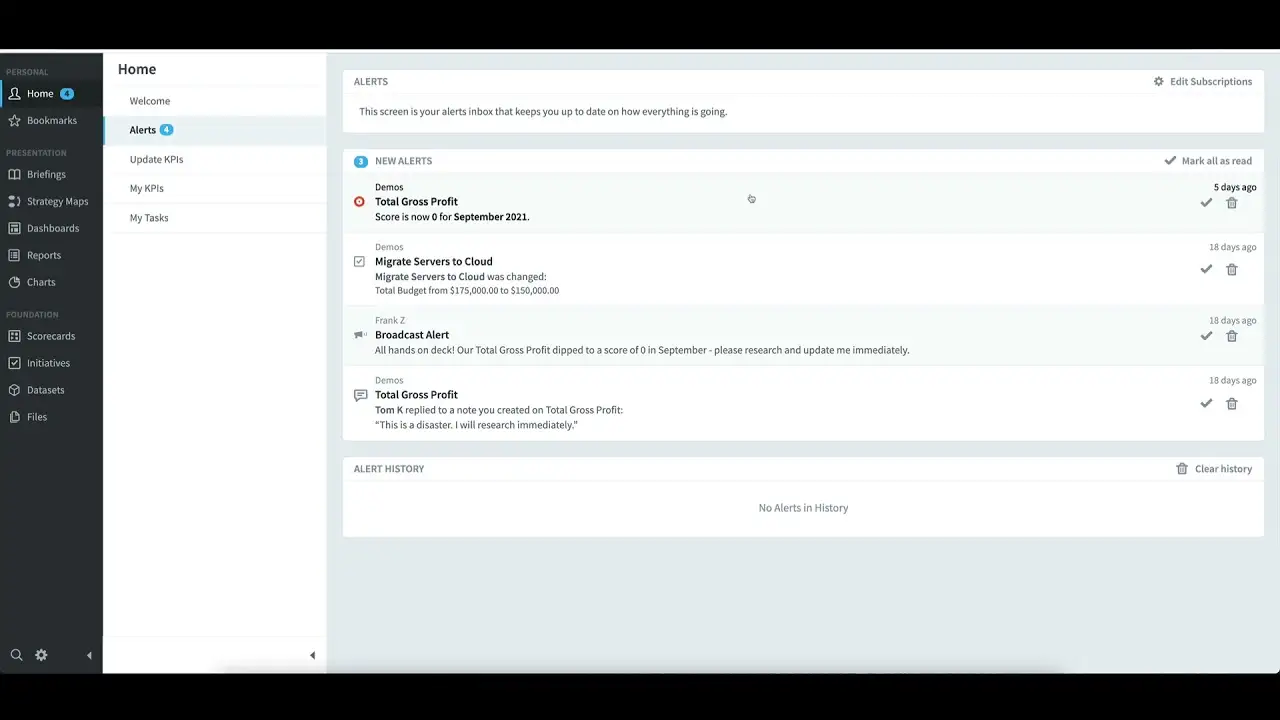
What's New in Spider Impact Version 5.6
Spider Impact 5.6 delivers improvements in virtually every area of the software, but the theme of this release is getting data in and out of Spider Impact. Forms now have advanced logic so they can react to user input as they collect data. There’s a new API for organizations and scorecards, allowing you to see your KPI performance in apps outside of Spider Impact. Most importantly, there’s now an ability to import data from any app that has a web service API.
Getting Started
Experience Spider Impact for Free
Schedule a live demo or claim your free 30-day trial. We’re standing by to either show off Spider Impact or turn your data into a prototype for free.


