How To View Initiative Impact on Scorecard Items with Spider Impact

One great feature of Spider Impact is the ability to visualize and understand the effect that your initiatives are having on your scorecard items. Having this knowledge enables you to stop investing in under-performing initiatives, and to course-correct by implementing initiatives that will better help you meet your strategic performance goals. Here, we’ll take you through the process of visualizing this information within Spider Impact.
When scorecard and initiative items are designated as related items, that relationship is shown on the Overview tabs. Spider Impact also shows information about how the initiative item is affecting the scorecard item. You can hover the mouse over the icon to see if there is a positive impact, negative impact, mixed impact, or no impact.
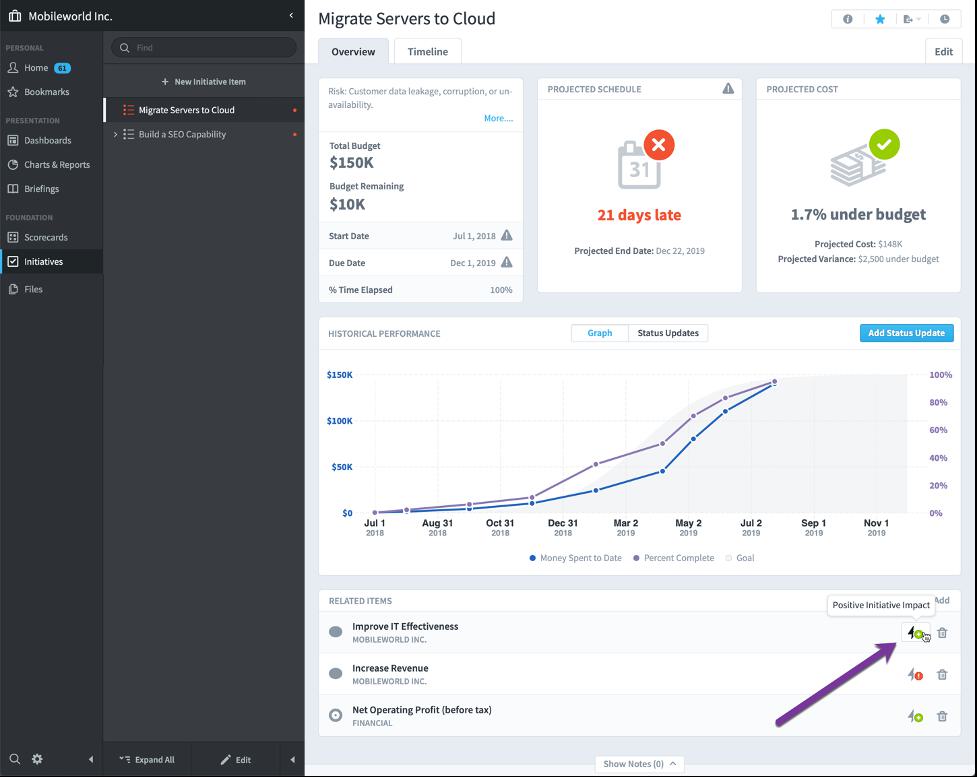
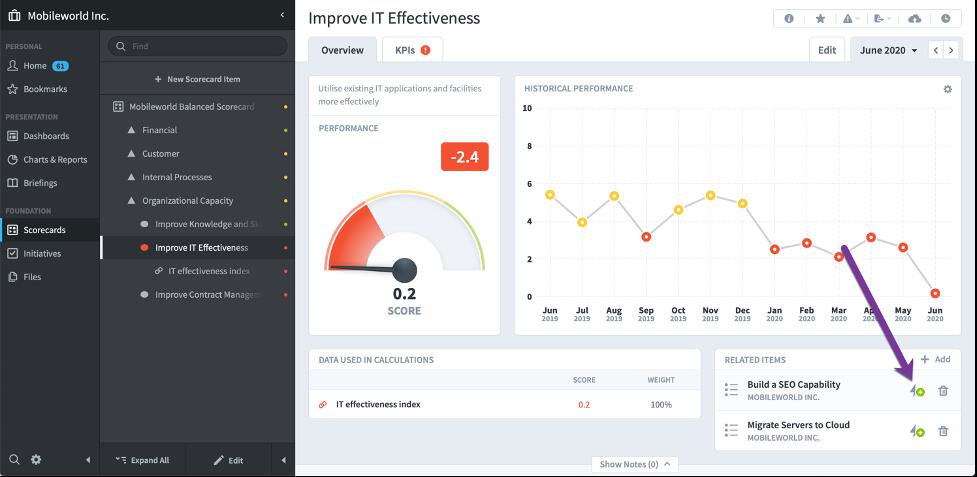
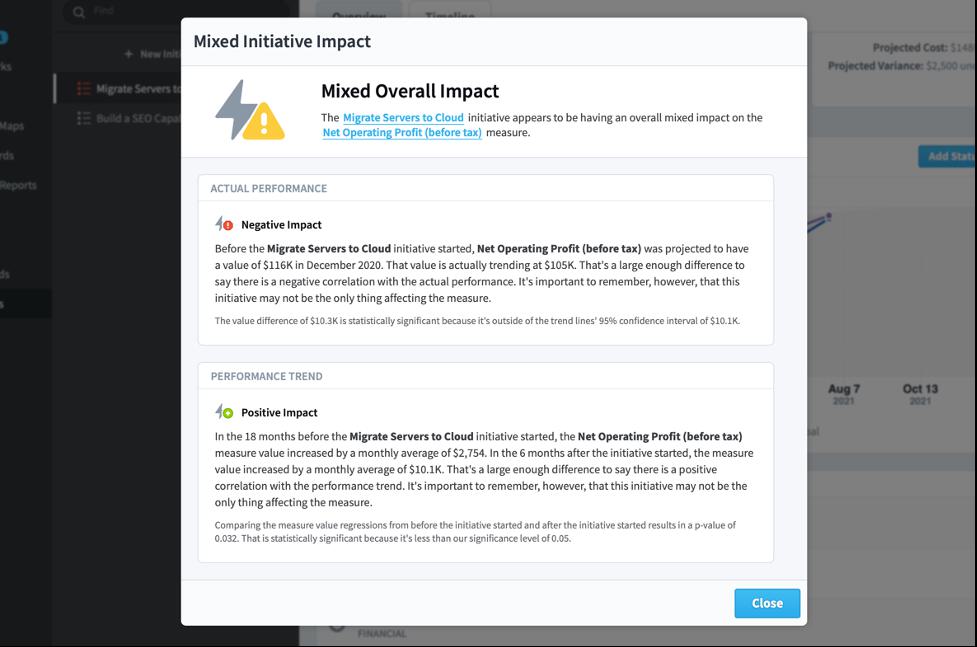
Clicking on the icon opens a dialog showing the details behind the relationship. The overall impact is based on combining the actual performance and the performance trend.
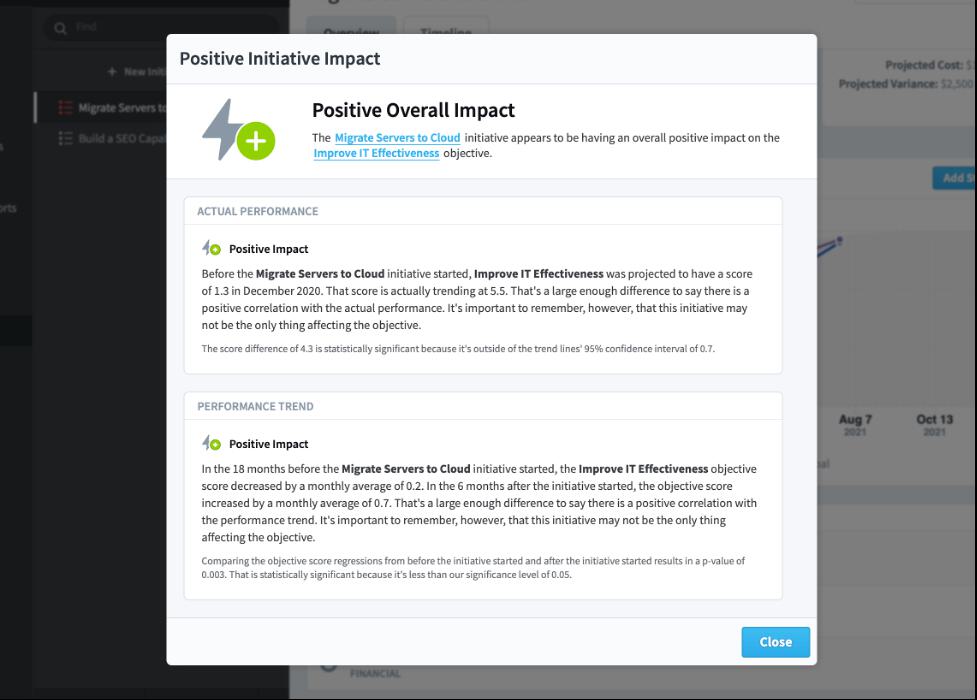
The actual performance impact is determined by comparing the scorecard item’s current score with how the scorecard item was projected to have performed based on its scores from before the initiative item started. If the actual performance difference is statistically significant in either direction, then the initiative item is having a positive or negative impact on the scorecard item. Otherwise, it is having no effect.
The performance trend is determined by comparing the angle of two trend lines. The fist trend line is based on the scorecard item’s scores *before* the initiative started. The second trend line is based on the scorecard item’s scores *after* the initiative started. If the difference in the angle of the trend lines is statistically significant, then the initiative item is having a positive or negative impact on the scorecard item. Otherwise, it is having no effect.
Considering both actual performance and performance trend are important when looking at overall impact. It’s possible that an initiative has increased IT costs in a one-time spike, but the overall IT cost trend is much better than before. This situation would be considered a mixed impact because there is a negative impact on actual performance while simultaneously having a positive impact on the performance trend.
Two negative impacts combine to a negative, and two positives combine to a positive. A positive and a negative combine to a mixed. Two no impacts combine to a no impact. A no impact combined with a negative becomes negative, and a no impact combined with a positive becomes a positive.


Experience Spider Impact for Free
Schedule a live demo or claim your free 30-day trial. We’re standing by to either show off Spider Impact or turn your data into a prototype for free.