Streamline strategy execution for ongoing business improvement
Pull data from spreadsheets, databases, SaaS tools, and forms
Frequently asked questions on security, hosting, and using Impact
University of Sharjah reduced reporting time from two months to instant generation, saving hundreds of staff hours while managing 1,000+ performance indicators across 14 colleges and 49 departments.
Get employees aligned and focused on achieving optimal business results
Use operational business intelligence as a foundation for strategy
Invest in high-performing initiatives; cut the rest
Get proactive intelligence and instant answers from your data
Deliver the right business information to the right people at the right time
Assess your strategy and identify key actions quickly
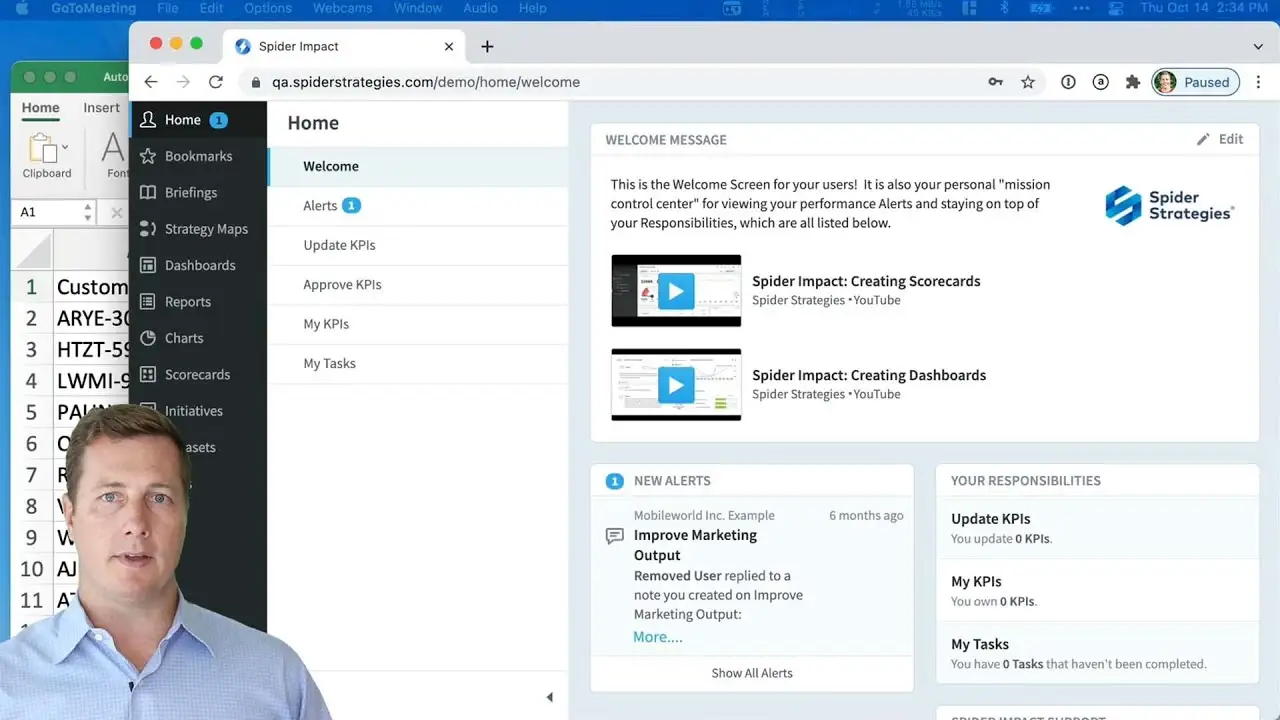
This is a full tour of Spider Impact 5.7, focusing on how different types of people use the software.
Spider Impact is the world's leading balanced scorecard software
Spider Impact uses EVM to forecast project timelines and budgets
Spider Impact automates your KPIs with dashboards, reports, and alerts
Build custom applications without developers—create your own systems of record
Balanced Scorecards align strategy with action by measuring performance across Learning & Growth, Internal Processes, Customer, and Financial perspectives, helping organizations achieve strategic goals through focused metrics.
U.S. Army unified performance management across all commands with Spider Impact, serving 28,000+ users. The system delivers 177,000 dashboards tracking 7 million data points, providing decision-makers with critical information from field operations to Secretary level.
The Dubai Ports, Customs and Freezone Corporation reduced quarterly reporting time by 50% and eliminated 3.5 days per ad hoc report with Spider Impact, centralizing project management and automating KPI tracking across multiple institutions.
African Development Bank transformed initiative management with Spider Impact, delivering previously stalled 4+ year projects within one year. The bank expanded from 20 to 60+ users, breaking down silos across business units and providing executive reporting that impressed the President enough to recommend bank-wide adoption.
Get the most out of Spider Impact with self-paced "how to" videos
Fast-track your success with training and consulting tailored to your needs
Complete interactive documentation for using Spider Impact
Information about strategy execution and performance management
Printable PDF versions of "Using Spider Impact" documentation
View our system requirements, support roadmap, and more
48:30 min
17:19 min
18:57 min
16:41 min
Measure progress to optimize performance for customer service
Track uptime and security to user satisfaction and productivity
Track and measure your progress to achieve organizational success
Modern BI software turns complex data into clear insights through powerful visualizations anyone can use. Create interactive dashboards, spot trends instantly, and predict future performance—giving teams the right information at the right time for smarter, data-driven decisions.
Accelerating stalled projects and improving initiative management.
How leading banks overcome obstacles in strategic planning and execution.
Improving community transparency in law enforcement.
Transform central bank strategy into measurable results with effective KPIs.
Your roadmap for turning strategy into measurable business outcomes."
Performance management strategies for community health organizations.
Select the right KPIs for each of your departments.
Transform complex federal operations into coordinated, results-driven programs.
A practical guide to capturing objectives, measures, and initiatives for clear, actionable strategy.
Navigate strategic planning challenges unique to colleges and universities.
Step-by-step guide to create metrics that drive strategic success.
Learn how to set and manage KPI thresholds that improve performance visibility and decision-making.
Transform strategic plans into measurable progress for local government.
Build a culture of performance measurement and strategic success.
Higher education strategic reporting transformation case study.
Identify focus areas that maximize organizational impact and results.
Learn how to consolidate legacy systems, reduce risk, and improve mission performance with a connected approach to strategy and data.
See how organizations align strategy, KPIs, and compliance into a single, governed performance environment.
FMCG leader's strategic planning and execution success.
Replacing a legacy application and saving $1.2 million annually.
Creating an enterprise-wide Common Operating Picture for strategic decision-making.
Nonprofit success story with strategic planning and performance management.
Transform abstract strategies into clear visual representations.
Transform your community health system with strategic performance management that turns challenges into advantages. Our actionable guide helps you maintain agility, leverage data, and empower your team while preserving what makes your organization special—the perfect blueprint for mission-driven healthcare leaders.
Get in touch and tell us how we can help you
Discover who we are, what we do, and how we got here
View our current career openings
Join us for a one-on-one interactive session to explore Spider Impact and answer your questions in real-time.
We’ll turn your data into a fully functional prototype. Unrestricted 30-day free trial, no credit card required.
Take a quick 3-minute look at your strategy execution and discover opportunities for immediate improvement.
Quickly auto-generate and customize a strategy map in Spider Impact.
How to build scorecards, create new organizations, and create & manually update Measures/KPIs.
17:06 min
Introduction to creating Initiatives, Tasks, and Milestones and how to relate and present those elements along with the scorecard measures they are intended to affect.
3:35 min
Build dashboards with the free-form canvas using chart, bubble, note, speedometer, image, and text widgets.
14:24 min
Learn about how to create charts, including line, bar, pie, area, donut, and many more. Add analytic items like trend lines, forecasts, reference lines and bands, and stacks.
11:27 min
Create reports for scorecard items, initiatives, and datasets. Sort, apply formatting, group, aggregate, and more.
Learn about the business intelligence layer that powers all of Spider Impact. Create, links, update, and explore unstructured data. Create dataset KPIs powered by underlying data.
6:28 min
See the value of Briefings for presenting performance data and learn how to quickly create them.
29:15 min
Automate the creation and updates of scorecards/initiatives from spreadsheets and databases.
14:27 min
If you're building multiple scorecards with similar measures, save a lot of time and effort by using Copy, Templates, and Rollups.
17:58 min
Discover the transformative power of dataset rollup trees with our comprehensive video guide. From the basics to advanced applications, learn how to utilize Spider Impact for aggregating hierarchical data and managing extensive user permissions effortlessly. Using a practical example of fake U.S. Army physical fitness test data, the video demonstrates the step-by-step process of creating and analyzing datasets, including setting up roll-up trees, assigning user permissions, and leveraging data for insights. Perfect for organizations seeking to streamline data management and enhance decision-making capabilities. Watch now to unlock the potential of dataset roll-up trees in your data strategy. Connect with us to learn more: www.spiderstrategies.com/contact
6:35 min
Creating Linked Scorecard Items in Spider Impact. This allows you to track KPIs in one place yet use the data everywhere. Create themed scorecards. Connect with us to learn more and get a free trial: www.spiderstrategies.com/demo
4:55 min
Using Files, Notes, and Related Items to keep information at your fingertips. This allows you to see the relationships between items in the software. Connect with us to learn more: www.spiderstrategies.com/contact
10:16 min
You can create geographic maps in the Charts section that visualize your geographic datasets data. They're fully interactive, allowing you to zoom in and out, filtering your data by region. You can even embed maps on dashboards. Connect with us to learn more: www.spiderstrategies.com/contact
Schedule a personalized tour of Spider Impact, then start your free 30-day trial with your data.