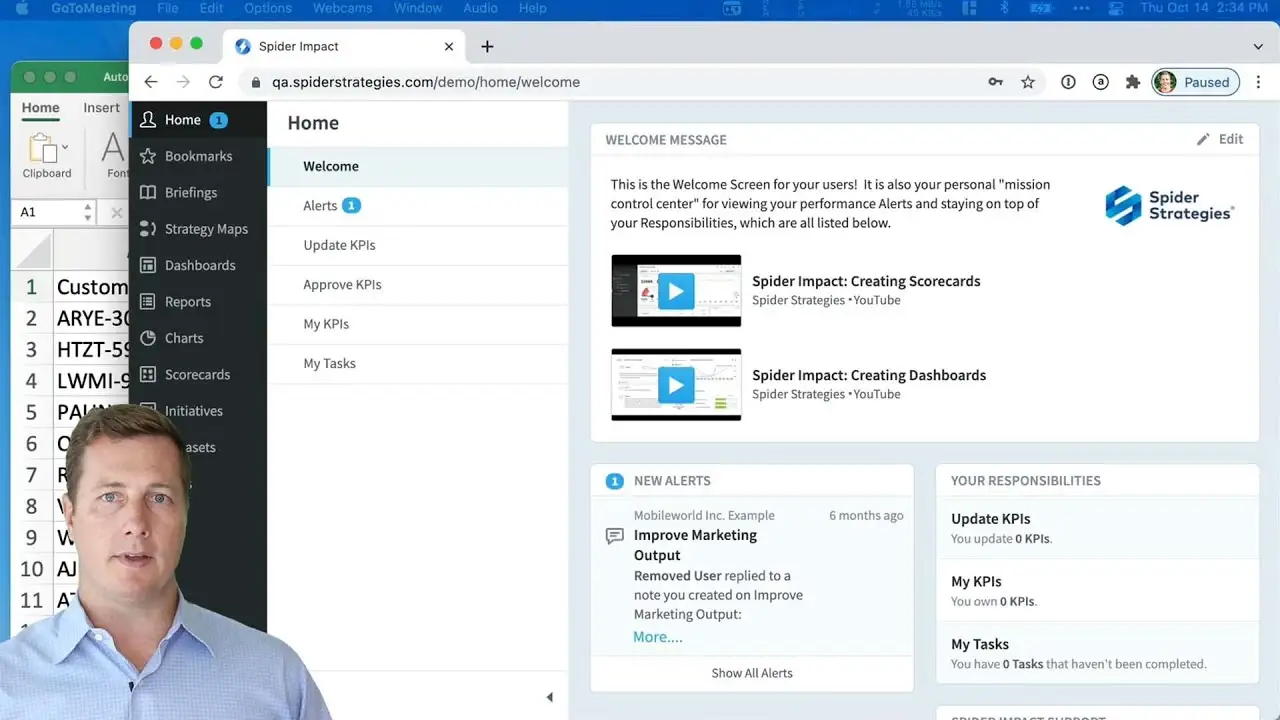
Creating Geographic Maps
You can create geographic maps in the Charts section that visualize your geographic datasets data. They're fully interactive, allowing you to zoom in and out, filtering your data by region. You can even embed maps on dashboards. Connect with us to learn more: www.spiderstrategies.com/contact
Building
Demo then Free Trial
Schedule a personalized tour of Spider Impact, then start your free 30-day trial with your data.


