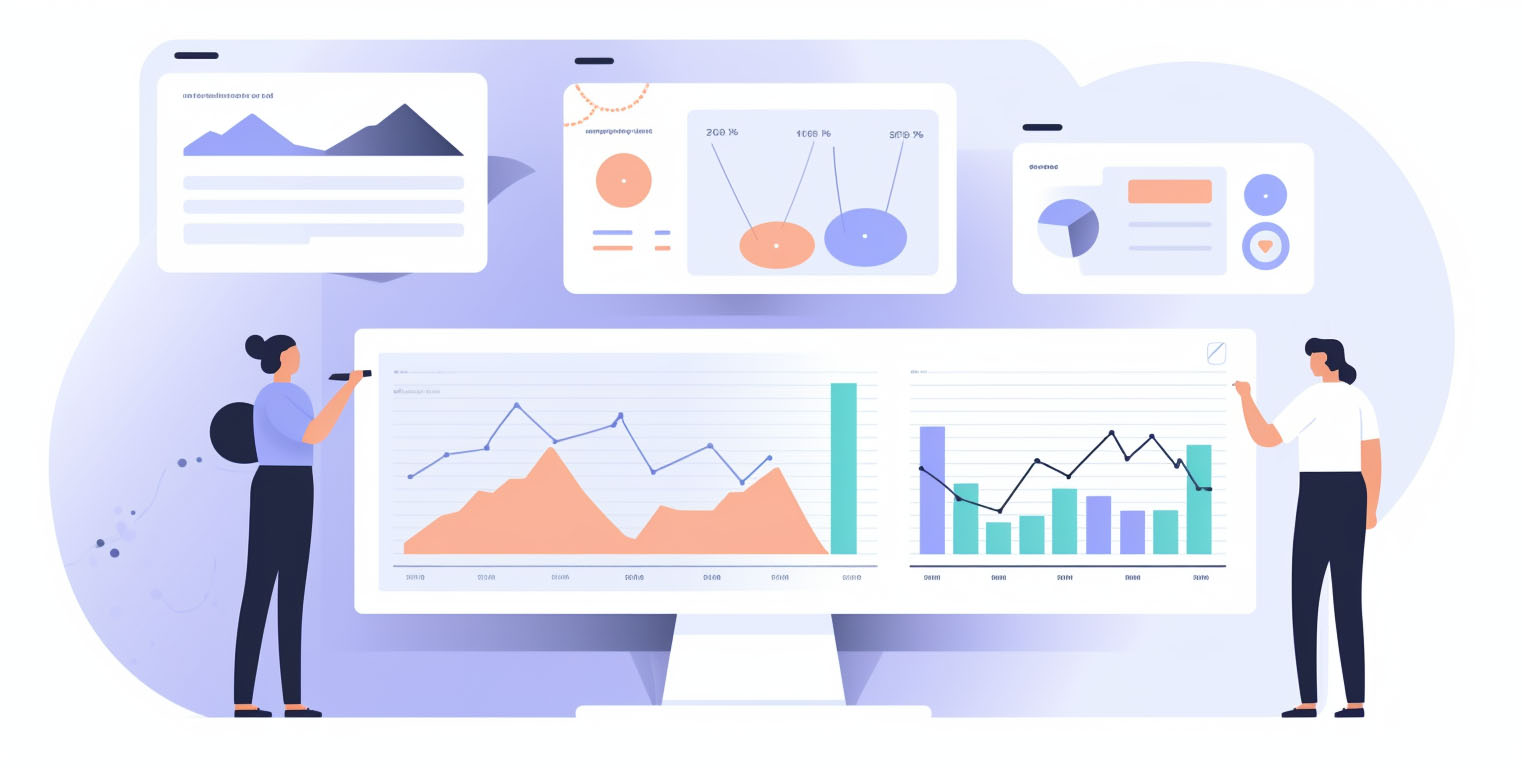
From Data Chaos to Data Clarity: The Benefits of Being Data Literate

The world of business data is changing at an unprecedented pace. Machine learning and generative AI are redefining how organizations use their exponentially increasing amounts of data. Predictive algorithms are offering insights never before available to those who know where to look.
Amid all of this growth and advancement, employees need to speak a common language. They need a shared set of analytical skills to communicate, share, and thrive.
What is Data Literacy?
Simply put, data literacy refers to the capacity of someone to take a dataset, ask questions about it, and come to conclusions about the data. Someone who is data literate can read, clean, analyze, and engage with the data in a way that provides meaning to others. A data literate person will also demonstrate competency in using data analytics tools such as self-service business intelligence and Microsoft Excel.
You do not have to be a professional data scientist or analyst to have data skills, of course. In fact, these skills are especially important for those who do not work primarily in an analytics role, as data literacy skills empower employees to join the data culture and take data analysis into their own hands. Sure, big data can seem intimidating, but data literacy is critical enough that everyone should try honing their skills.
The Importance of Data Literacy
It is important for as many people as possible in an organization to have at least a basic understanding of data. Some of the many benefits of being able to read and interpret data sets include the following:
- The capacity to make better decisions for yourself, your team, and your business as a whole
- The chance to gain a competitive advantage over your business competitors by using all data sources available
- The ability to increase productivity, as you no longer have to wait for a data analyst to draw conclusions from your data
- The ability to ask more intelligent questions and receive better answers regarding your organization’s operations
Business leaders and decision-makers across all industries use data science in their decision-making processes. For example, the entertainment and streaming industries use algorithms to show customers the television shows and movies that will most appeal to them. This contributes to the success of a streaming platform by helping to ensure more satisfied customers who spend a greater amount of time on its platform than that of a competitor.
Besides all of the advantages of having data literacy skills, there are also risks that come with not having any of these skills. One of the risks of data illiteracy is that it can contribute to the spread of misinformation due to misinterpretation of the data. For example, a data illiterate person will often assume that correlation equals causation, or fail to notice a misleading truncated chart y-axis.
The Components of Data Literacy
To better understand data literacy, it is helpful to break the concept down into smaller pieces.
Data Types
There are four different types of data that employees will encounter:
- Ordinal, or data that you can easily order, such as numerical placement in a competition or letter grades on a report card
- Nominal, or data that gives a descriptive label, like hair color, marital status or occupation
- Discrete, or data that comes in whole numbers, such as the number of students in a classroom
- Continuous, or data that may not fall on a whole number, such as temperature or the height or weight of a person
The type of data you are working with will affect how you clean, analyze and interpret the data. Data also comes in various formats, all of which data professionals should be familiar with. Text and numeric are two of the most common data formats; there are also subsets such as TXT or HTML within these format types.
Data Sources
The data source is also important when it comes to data analysis and data management. Users can source data from first-hand sources such as surveys, or collect it second-hand by, for example, noting the number of occupants in cars that pass on the road.
Data Tools
There are also different types of analysis and data visualization tools to assist you with data-driven decision-making. Business intelligence software allow users to create visually appealing dashboards and other infographics to present to managers and stakeholders. Automated meeting software eliminates countless hours of PowerPoint slide preparation, and answers questions in real-time by allowing you to drill into your data during meetings.
Best Practices
Once you master visualization tools, it is essential to understand some of the best practices that go along with presenting your data. These include:
- Making your charts and graphs stand out with minimal clutter
- Explaining what your visuals mean with the use of keys and legends
- Paying attention to the colors that you use
- Using the correct type of chart for your data
Because data visuals are meant for people who may not have a deep understanding of the dataset you used, keep them as simple as possible while still conveying the data’s fundamentals and other key points.
Strategies for Improving Data Literacy Skills
If you are looking to improve your data literacy skillset, you are in luck, as there are plenty of data literacy training programs, webinars, and other online courses available. Some ways you can increase your data knowledge include:
- Looking at examples of data visualizations, including ones that could use improvement
- Practicing cleaning and analyzing data on your own with an open online dataset
- Participating in an online course at a beginner, intermediate, or advanced level
- Attending a conference for data professionals and speaking to people who have many years of experience with data governance and analysis
Coursera and Khan Academy are just two of the many online resources available to assist with improving data literacy skills. Some of their programs are free, and many you can complete on your own schedule.
Skills To Learn
The fields of data and business intelligence are vast, and it can be difficult for people to know where to begin their data literacy journey. The following are some skills to consider when searching for courses:
- Data cleaning, or the process of taking raw data that has typos and formatting errors, and making it more consistent
- Data analysis, or the process of looking at cleaned data for correlations and trends
- Data governance, or the management of a data set and its permissions
Depending on how an organization is structured, an employee who works with data may have one, some, or all of these responsibilities.
Jobs To Consider
You do not have to be a professional data analyst to become literate in the field. However, if you find that you enjoy working with data, there are a few lines of work to consider:
- Business intelligence analyst, who delivers the results of the data and offers suggestions to decision-makers
- Database administrator, who looks for the most efficient and secure ways to store data
- Chief data officer, who works closely with all employees involved in data maintenance and analysis
Challenges Around Data Literacy
Becoming data literate is hugely advantageous. However, there are some challenges that you might meet on the way to becoming literate and putting your skills to use.
Lack of Employer Cooperation
One challenge that you might encounter is a lack of cooperation from your place of employment. Managers who have been with a company for a long time can become complacent and resistant to trying anything new. They might think, for example, that nobody in the company has made good use of data before, so there is no point in spending the effort required for employees to become data literate. It is especially tough to deal with this challenge when a lack of appreciation for data is rooted in a company’s culture. One way to overcome this hurdle is by showing the more resistant people some real-world examples of times when data improved a company’s profits or operations.
Lack of Good Data
If there is a lack of acceptable data, your data won’t be very helpful regardless of how well you are able to clean, analyze and interpret it. There can be many reasons why a business would lack good data, including having a history of not collecting data at all, or collecting the wrong types of data needed to make informed business decisions. The only way to overcome this challenge is to consider what goals you want to accomplish with your data and begin collecting as soon as possible.
Lack of Involvement
Sometimes, those who possess the most data analysis skills congregate in similar jobs with each other. For example, an organization might have a department where skilled people keep datasets clean and secure. However, these people may not work closely with those who are actually using the data. This can lead to a gap between those with more experience with data and those who are making decisions with the data. One of the ways to overcome this is to set up regular meetings between these two groups.
Any organization change is going to get push-back, including implementing a data literacy program. However, something as important as data literacy is worth fighting for.
Real-World Examples of Data Literacy in Action
Data literacy can be a rather abstract idea to talk about; however, it has very real implications. Here are some real-world examples of data literacy in action.
Higher Education
An institution of higher learning may employ data analysis to discover a correlation between GPA and the types of scholarships received, or the number of years it takes a student to graduate. If the employees at the university find any interesting insights, they can implement changes to help more students to succeed.
However, analysts need to be careful to avoid making assumptions based on false correlations. For instance, students receiving a particular scholarship might have higher GPAs because the financial assistance allows them to focus more on their studies. Or, what appears to be improved academic performance may be a result of only the highest achieving students receiving a scholarship in the first place.
Marketing
Another example of data literacy in action is in the marketing sector. Many online tools compile data for marketing managers to use. For example, managers can see how many website visitors view a page, and adjust the links on their website according to those metrics. In addition, many marketing companies use search engine optimization (SEO) to improve the number of visits they get. The data behind this SEO guides companies toward which words to use in the articles they release.
The more experience you have with using data and honing your data science skills, the more you will be able to see how data analysis applies to real-world scenarios.
Empower Your Data
When you use data to make evidence-based decisions, you gain the peace of mind of knowing that your choices are backed by hard facts. Data literacy enables everyone in your organization to look for insights in their own data, and encourages people to share their opinions regarding what decisions to make next. To truly harness the power of your data, it’s not enough to simply understand what it is. You also need the right tools to effectively visualize and communicate your findings.
That’s where Spider Impact comes in. Sign up for a free trial or demo to see how Spider Impact can accelerate your journey towards being a data-driven organization.
Demo then Free Trial
Schedule a personalized tour of Spider Impact, then start your free 30-day trial with your data.


