Executive Reporting 101: Best Practices and What's Expected

To do business in the 21st century, managers and directors must make decisions quickly. More important than speed, however, is their ability to use constantly changing data to make informed choices.
How can your organization simultaneously match the accelerating pace of fierce competition while also avoiding employee burnout?
We believe automation is the key to success. Automated executive reports help you collect, collate, and display your organization’s data for upper management. This approach empowers you to identify essential metrics and factors at a high level instead of anecdotes from those in the trenches.
In short, an executive report gathers a small number of high-level key performance indicators to make it easy to see where you are, what you're doing, and where you're going if you don't make a change.
How Does Executive Reporting Help?
The days of manually graphing data from a spreadsheet are long gone — and we all know how many hours that saves. Having all of this information at a glance, collected in one spot, makes management's job faster and easier. All executive reports compile the data into the visual medium of your choice, making it easier to read.
Speed
Automating your executive reporting saves a surprising amount of preparation time. You build reports and dashboards once, and then they're automatically and regularly emailed to key stakeholders.
Automated executive reporting is about more than just saving time, though. It's also about providing the freshest data possible to those who need it most. Your up-to-date KPIs are always available on-demand, allowing your leadership team to make snap decisions based on the most recent information. When everything from workplace policy to supply chain trends can change instantly, it's critical never to make decisions based on outdated information, especially when the impact of those decisions lasts for months or years.
Skip meetings. Stop manually creating reports. Quit playing the game of telephone between managers. Automated executive reporting saves you time and ensures everyone is making decisions based on your most recent data.
Accuracy
Data doesn't lie. Cold, hard numbers let you rely on facts instead of instinct or outdated ideas. By creating a shared set of executive dashboards and reports, your leadership team will have a single source of truth to base their discussions around.
Accurate information empowers. Your executive team shouldn't need to learn critical information from someone else, filtered through their lens and opinions. Executive reporting eliminates confusion and gives everyone the same data to keep them all on the same page.
Decision-making becomes faster and more efficient with accurate reports. Executives make decisions from the same accurate data, which is more critical than ever in the age of remote work.
Visualization
Since executive reports are all about efficiently getting the most important information to the most important decision-makers, they often contain data visualizations. KPIs come to life when shown as speedometers or gauges, providing leadership with the context of possible performance ranges. Bar and line charts are great for showing performance trends or comparing regions, product lines, or competitors.
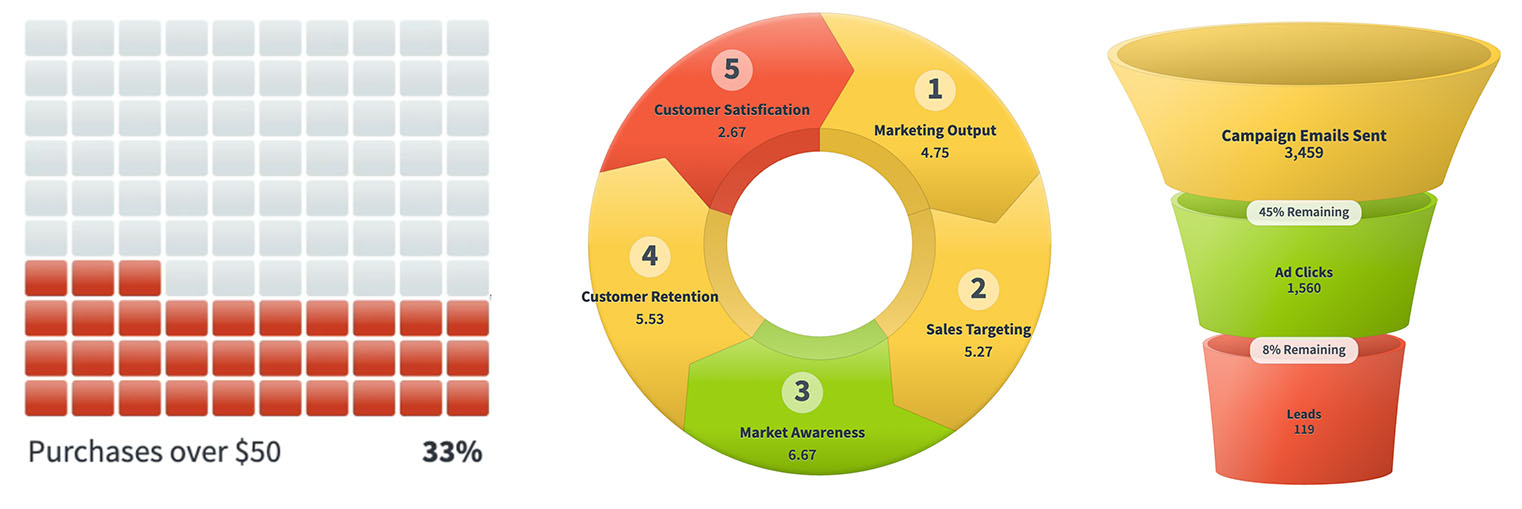
Data visualization can go much further, however, so it’s important to choose executive reporting software that has an extensive library of data visualization options. Waffle charts are great for showing percentages. Cycle and process charts visualize how the different steps of interrelated process chains are performing. Funnel charts show sales and recruiting.

These pre-built visualizations allow you to plug in your data to existing smart objects so you spend less time making the data look good and more time acting on it.
Customization
While it’s important for all executives to have access to the same data, different executive teams do have different data reporting needs. For example, IT executive reports will focus on different KPIs than marketing executive reports. Corporate-level executive reports will often have just a few KPIs from every department.
Because of this, it should be very easy to customize your executive reports. KPIs need to be able to be added or removed quickly. Pre-built infographics need to be wired with live data in a few clicks.
It’s also important to provide information in a familiar format. Many executives are already accustomed to quarterly PowerPoint presentations with a specific look and feel. If you use an executive reporting tool with free form layout, you can recreate executive briefings that look identical to the familiar static presentations, except they’re always up-to-date with live data.
Getting the Most Out of Your Executive Reporting Platform
Good enterprise reporting software doesn't just show your data — it shows how you measure up to your goals. Key performance indicator reporting compares your real-time performance to your long-term goals and visualizes progress toward key milestones.
Reporting on the Go
We know how many enterprise applications are built in-browser, and the best executive reporting dashboards are no exception. With in-browser solutions, you can gather and report information from any workstation, laptop, or mobile device, which empowers managers to work from home or travel as they need.
Education and Training
Training for any new application represents significant expenses and challenges, but proper education is vital for the success of any software solution.
The potential of new applications must excite employees, who need to know the best ways to use their new tools. If they are thrown to the wolves and told this new software is mandatory, they will ignore it, circumvent it, or refuse to exploit its full potential.
Providers that offer training documentation and demos keep the rollout process smooth.
Give It a Try
We're happy to put our money where our mouth is. Try out our services today! Spider Strategies is ready to help you succeed and prove it for free.
Demo then Free Trial
Schedule a personalized tour of Spider Impact, then start your free 30-day trial with your data.


