Going from 0 to Power User
This curated training flow provides everything you need to go from absolute beginner to power user with Spider Impact. Watch videos that guide you through key features step-by-step, building your skills interactively. Learn how to log in, build scorecards and dashboards, create charts and maps, build reports, set alerts, create strategy maps, and much more. By the end, you'll have hands-on experience with our complete platform.
Videos (18)
We recommend watching these videos in order, but feel free to skip over any topics you're already familiar with or that don't apply to you.

Overview of Spider Impact 5.8
This is a full tour of Spider Impact 5.8, focusing on how different types of people use the software.
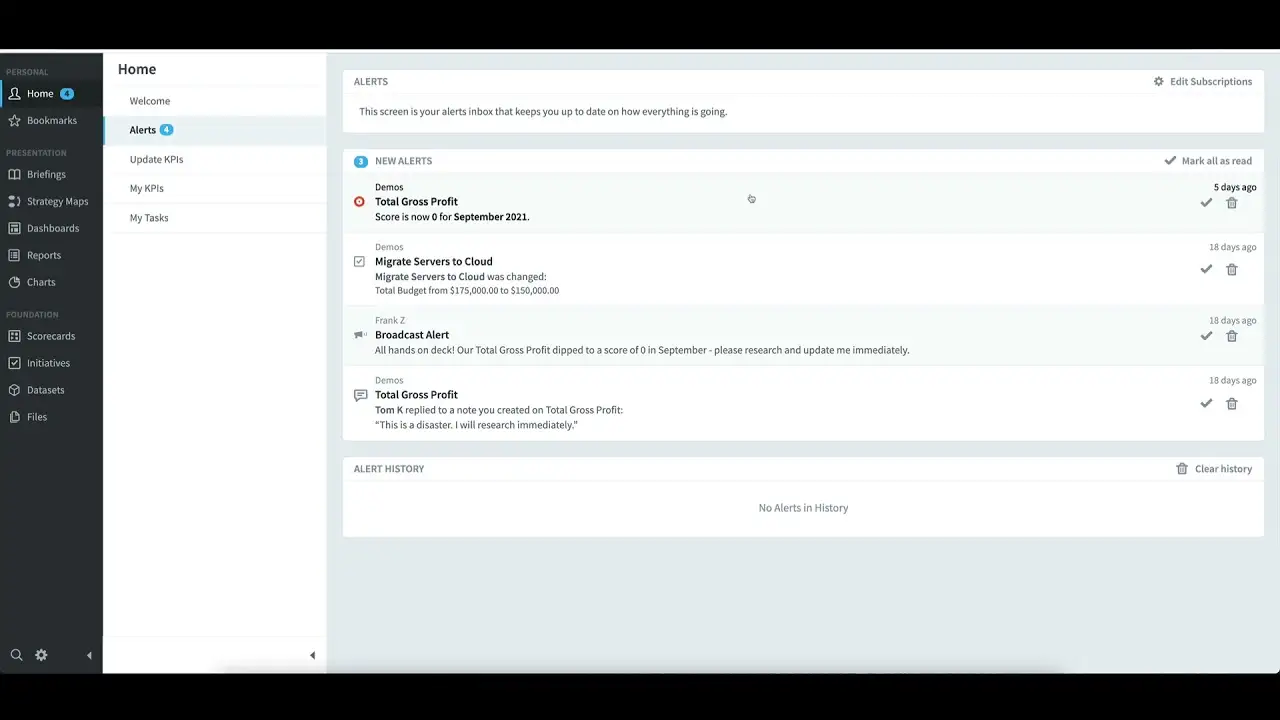
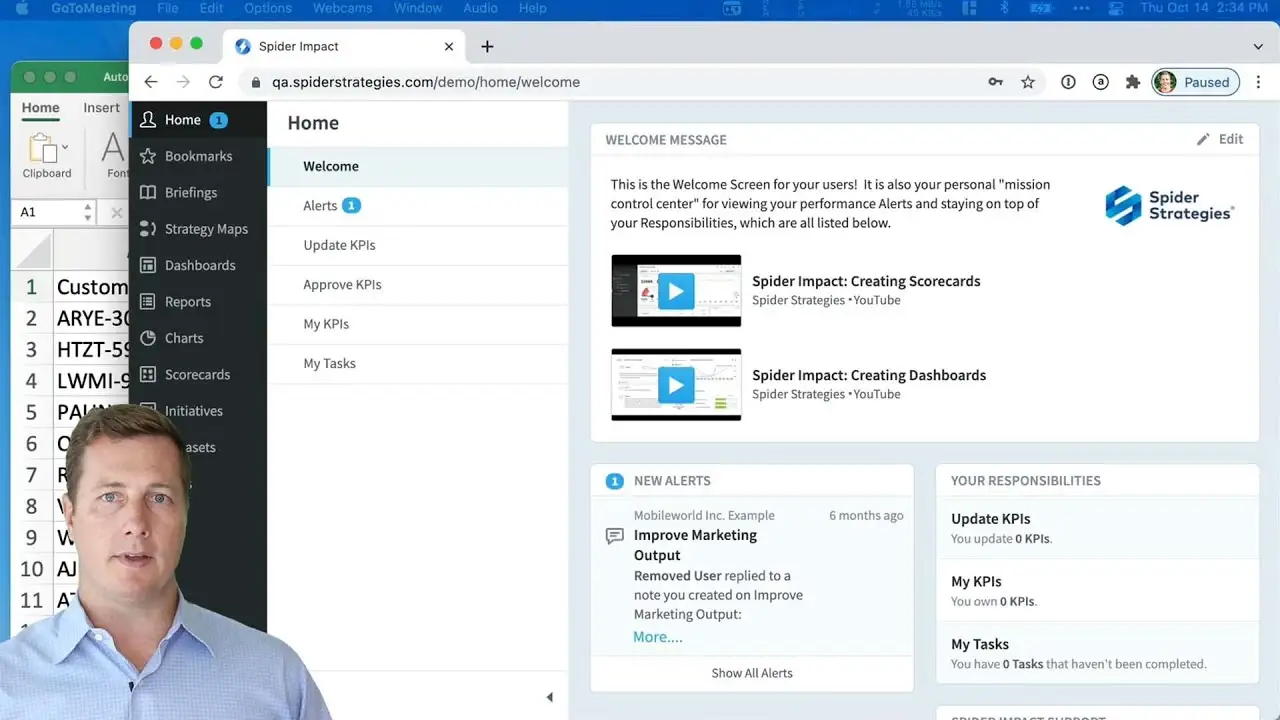
Logging In & Home Section
Logging in, overall navigation, and the Home section - including Alerts, My Measures/KPIs, Measure/KPI Updates, and My Tasks.

Creating Scorecards
How to build scorecards, create new organizations, and create & manually update Measures/KPIs.

Scoring and Colors
Explains the normalized scoring system and associated colors employed by Spider Impact that provide intuitive visibility to business performance.

Advanced: Building Scorecards Using Copy, Templates, and Rollups
If you're building multiple scorecards with similar measures, save a lot of time and effort by using Copy, Templates, and Rollups.

Initiatives, Tasks, and Milestones
Introduction to creating Initiatives, Tasks, and Milestones and how to relate and present those elements along with the scorecard measures they are intended to affect.

Building Scorecards and Initiatives via Imports
Automate the creation and updates of scorecards/initiatives from spreadsheets and databases.
Creating and Using Datasets
Learn about the business intelligence layer that powers all of Spider Impact. Create, links, update, and explore unstructured data. Create dataset KPIs powered by underlying data.

Creating and Sharing Forms
Forms is a section in Spider Impact that allows you to build forms that add and update dataset records. It’s perfect for supplementing datasets with additional fields that aren’t tracked in the system of record, but it’s also great for collecting and managing data that isn’t stored in any system of record.

Creating Strategy Maps
Quickly auto-generate and customize a strategy map in Spider Impact.

Creating Charts
Learn about how to create charts, including line, bar, pie, area, donut, and many more. Add analytic items like trend lines, forecasts, reference lines and bands, and stacks.

Creating Geographic Maps
You can create geographic maps in the Charts section that visualize your geographic datasets data. They're fully interactive, allowing you to zoom in and out, filtering your data by region. You can even embed maps on dashboards. Connect with us to learn more: www.spiderstrategies.com/contact

Creating Reports
Create reports for scorecard items, initiatives, and datasets. Sort, apply formatting, group, aggregate, and more.

Creating Dashboards
Build dashboards with the free-form canvas using chart, bubble, note, speedometer, image, and text widgets.

Creating and Using Briefings
See the value of Briefings for presenting performance data and learn how to quickly create them.

Creating Bookmarks
Create bookmarks for yourself and other users in Spider Impact.

Users, Groups, and Permissions
Discover the intricacies of managing users, groups, and permissions in Spider Impact with our detailed video guide. You'll learn how to navigate the organization tree, create and manage groups with various levels of access, and assign specific permissions to enhance data governance. The video walks through real-life scenarios, such as setting up a Marketing Admin group with Power User privileges, and demonstrates how to fine-tune access to datasets, ensuring data security and compliance. By watching, you'll gain insights into the software's robust permission system, enabling you to confidently audit and control access within your organization. This is an invaluable resource for anyone looking to streamline their data management processes in Spider Impact. Connect with us to learn more and get a free trial: www.spiderstrategies.com/demo

Creating and Using Calendars
Create and manage system calendars within Spider Impact.
Demo then Free Trial
Schedule a personalized tour of Spider Impact, then start your free 30-day trial with your data.