


FAQs
What Is Spider Impact's Role in Government Organizations?
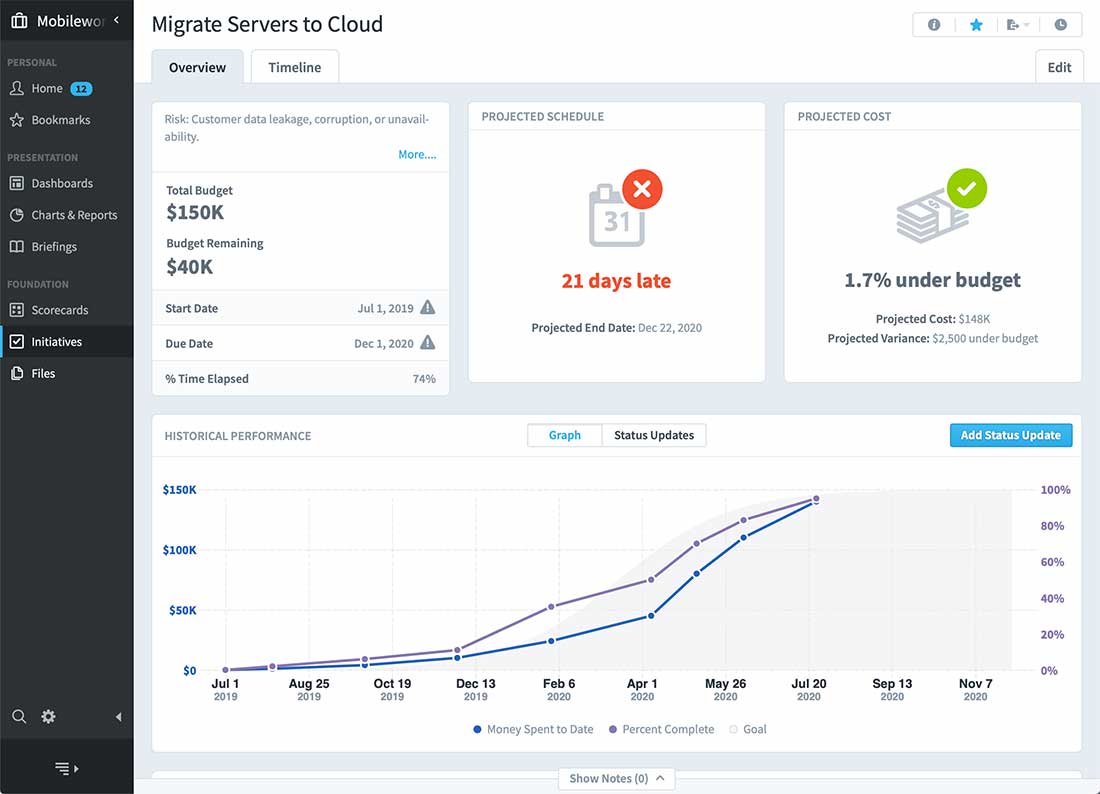
Spider Impact plays a pivotal role in government organizations by enhancing strategic management and execution. Our government management software helps align projects and initiatives with the organization’s overarching mission and goals. It provides tools to understand how each department contributes to these goals, offering a clear view of organizational performance. By visualizing trends and analyzing the cause and effect of various events, Spider Impact facilitates informed decision-making and strategic adjustments, so that the government's strategic plans are effectively implemented and monitored.
How Does Spider Impact Improve Strategic Plan Communication in Government?
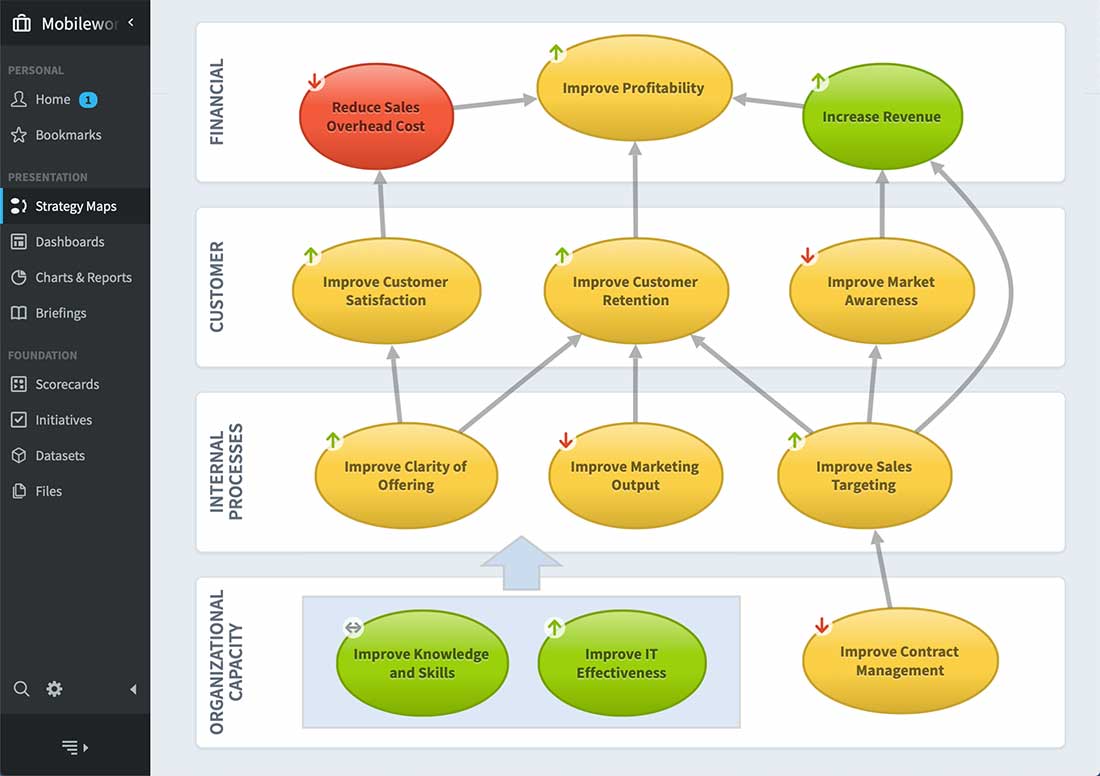
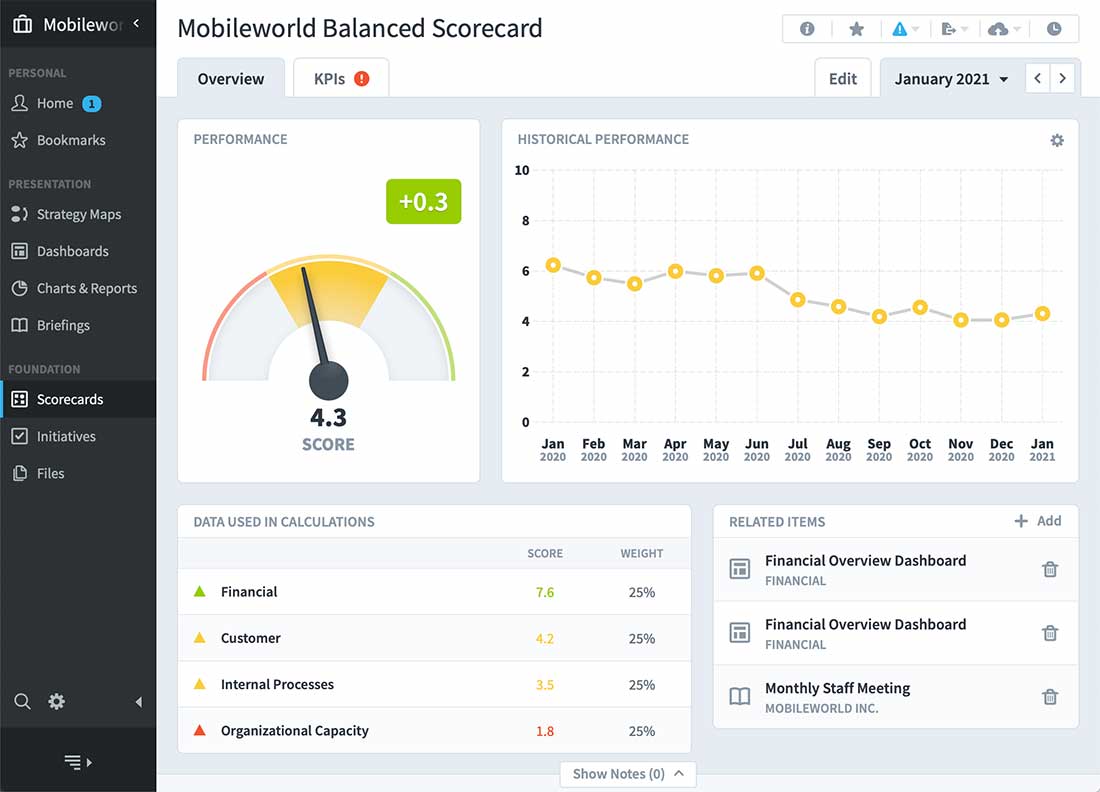
Spider Impact improves strategic plan communication within government agencies by providing a centralized platform where strategic objectives and performance metrics are easily accessible. It automatically consolidates weighted measures into overarching goals, making it clear how well the strategy is being executed across different departments. Interactive strategy maps, dashboards, and reports created within the government reporting software ensure that all employees have a clear understanding of their roles and how their efforts contribute to the overall strategic plan.
How Does Spider Impact Ensure Data Security in Government Agencies?
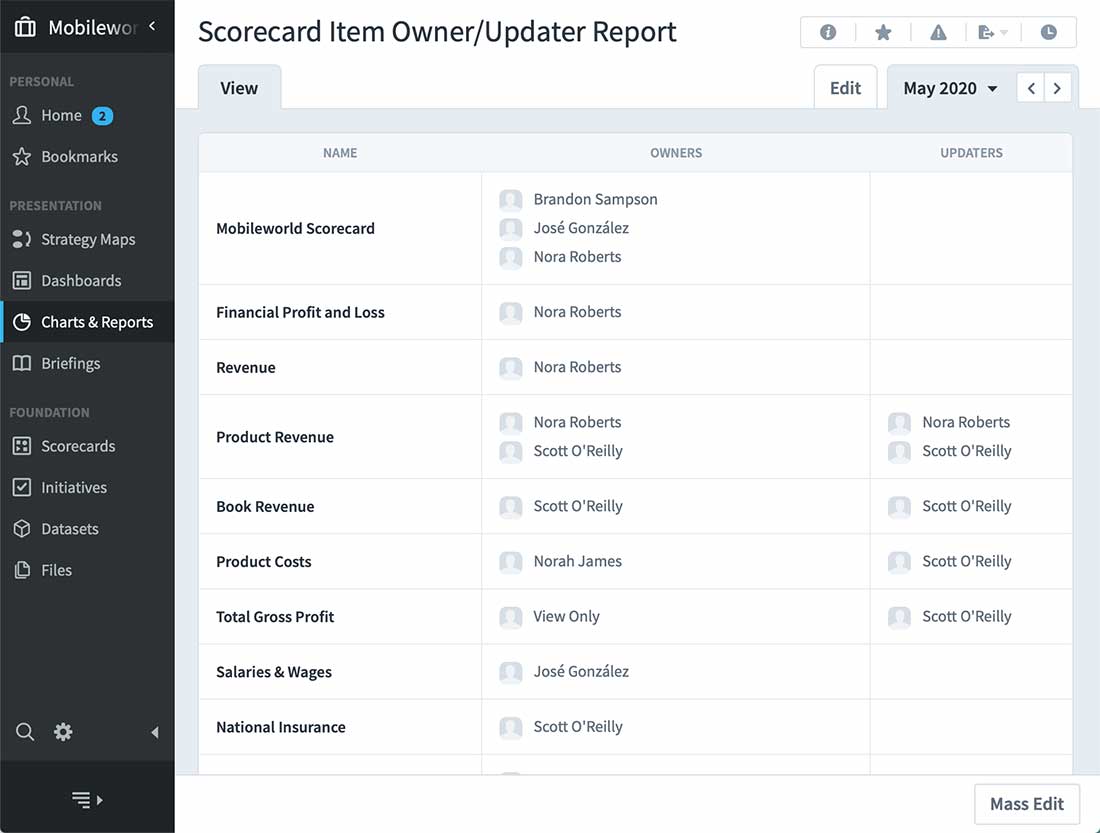
Our government management software ensures data security in government agencies by offering secure hosting options, either on-premises or in the cloud. For sensitive applications, such as those in defense and national security, Spider Impact provides tailored solutions to meet stringent security requirements. The software includes fine-grained permissions and audit capabilities to manage data access and ensure that only authorized personnel can view or modify sensitive information. This data governance framework helps protect against unauthorized access and data breaches, maintaining the integrity and confidentiality of government data.
How User-Friendly Is Spider Impact for Government Employees?
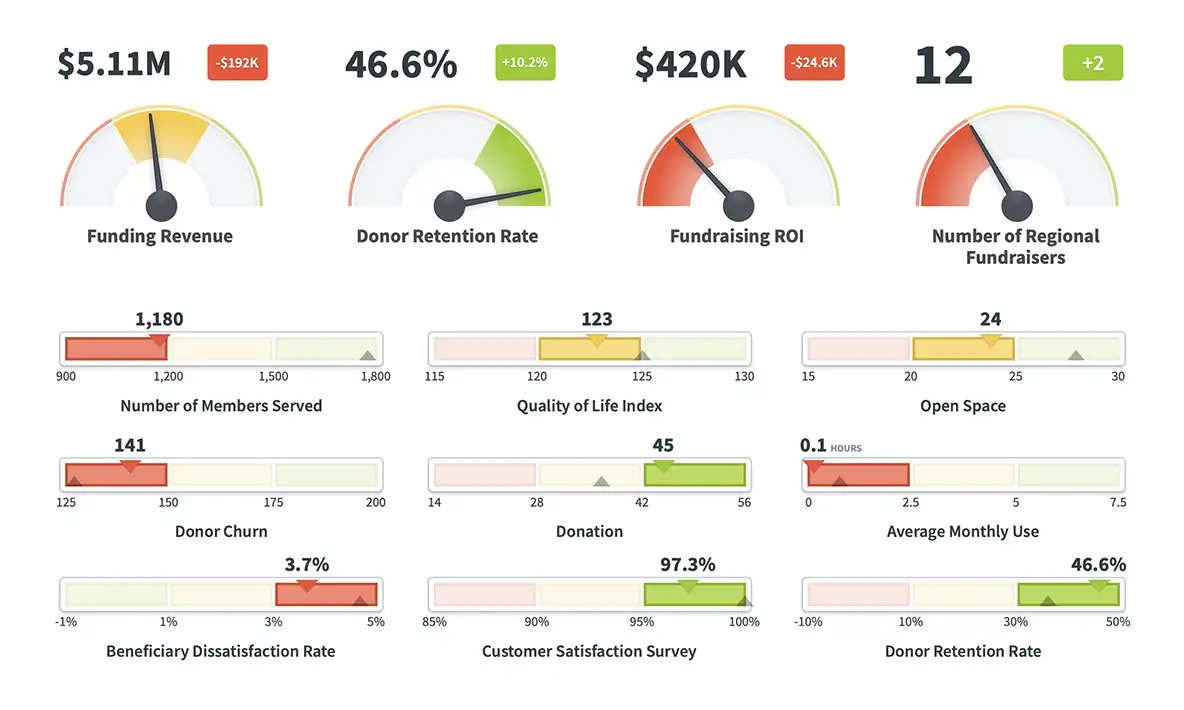
Spider Impact is designed with user-friendliness in mind, making it accessible for government employees at all levels. This government management software features intuitive interfaces and customizable dashboards that allow users to easily navigate and utilize its various functions. Training and support are also integral parts of the Spider Impact experience, helping employees quickly become proficient with the tools. Whether creating reports, tracking initiatives, or visualizing data, government employees can efficiently use our government reporting software to enhance their daily operations and strategic efforts.
How Does Spider Impact Facilitate Data-Driven Decisions in Government?
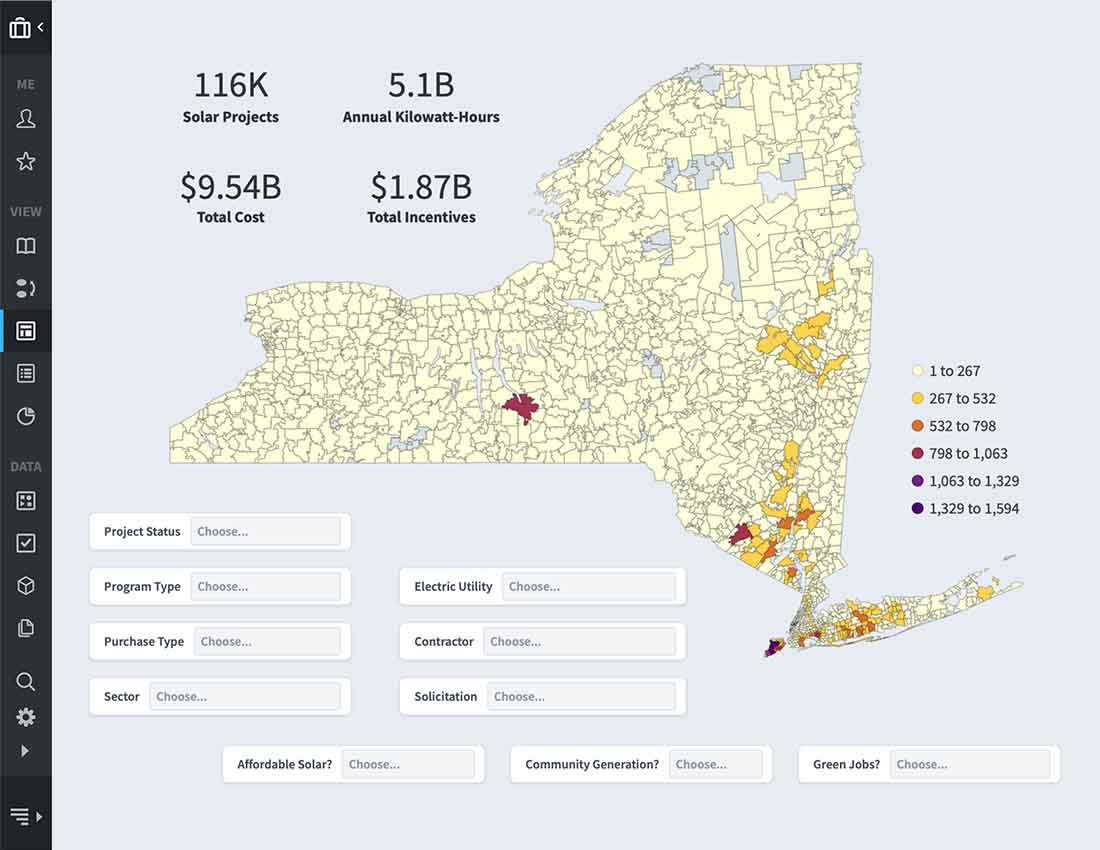
Spider Impact allows for data-driven decisions in government by providing real-time access to comprehensive performance data. The software's interactive dashboards and advanced data visualization tools help users analyze key metrics and trends, enabling more informed decision-making. By consolidating data from various sources and presenting it in a clear and actionable format, Spider Impact’s government reporting software allows leaders to base their decisions on accurate and current information.